PROPERTY-INSURANCE CLAIM HELP · FL & SC FL CITIESSC CITIESGUIDESTATESNEWSSITE MAPABOUT
HurricaneLaw.Pro HURRICANELAW.PRO
SILO 06 · THE STORM ARCHIVE

175 years of landfalls

51 storms documented, with tracks, wind, surge, and damage, plus the part the weather sites skip: what happened to the insurance claims afterward.

01 FLORIDA LANDFALLS
32 STORMS

Florida

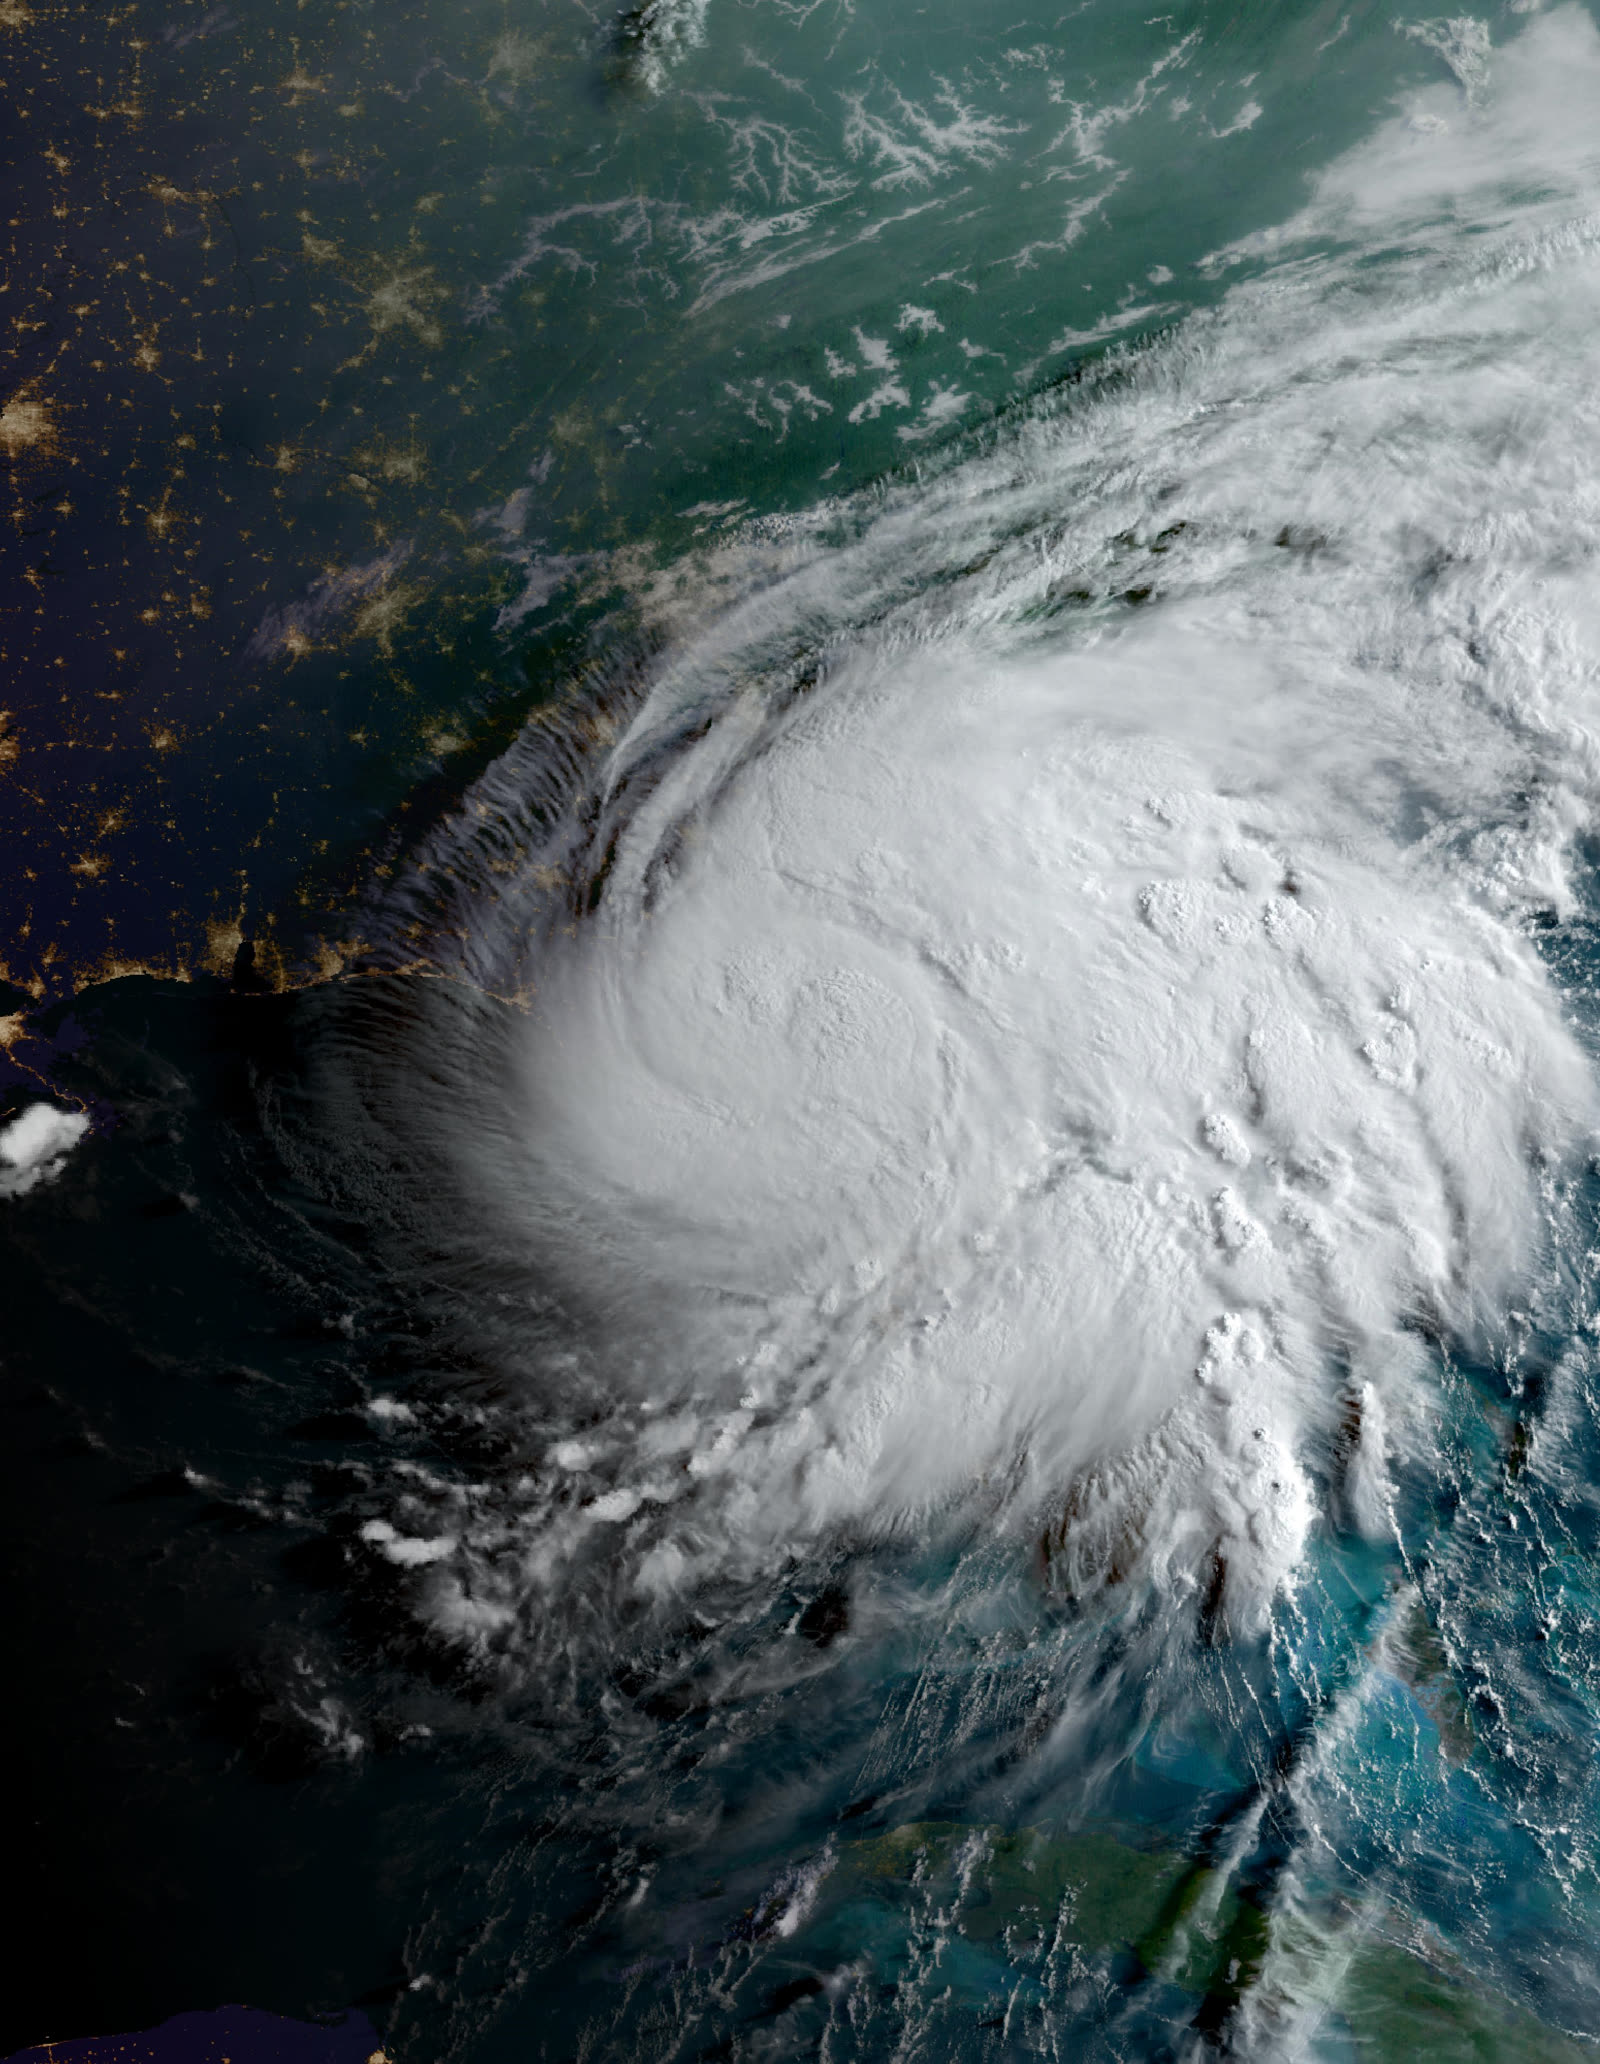
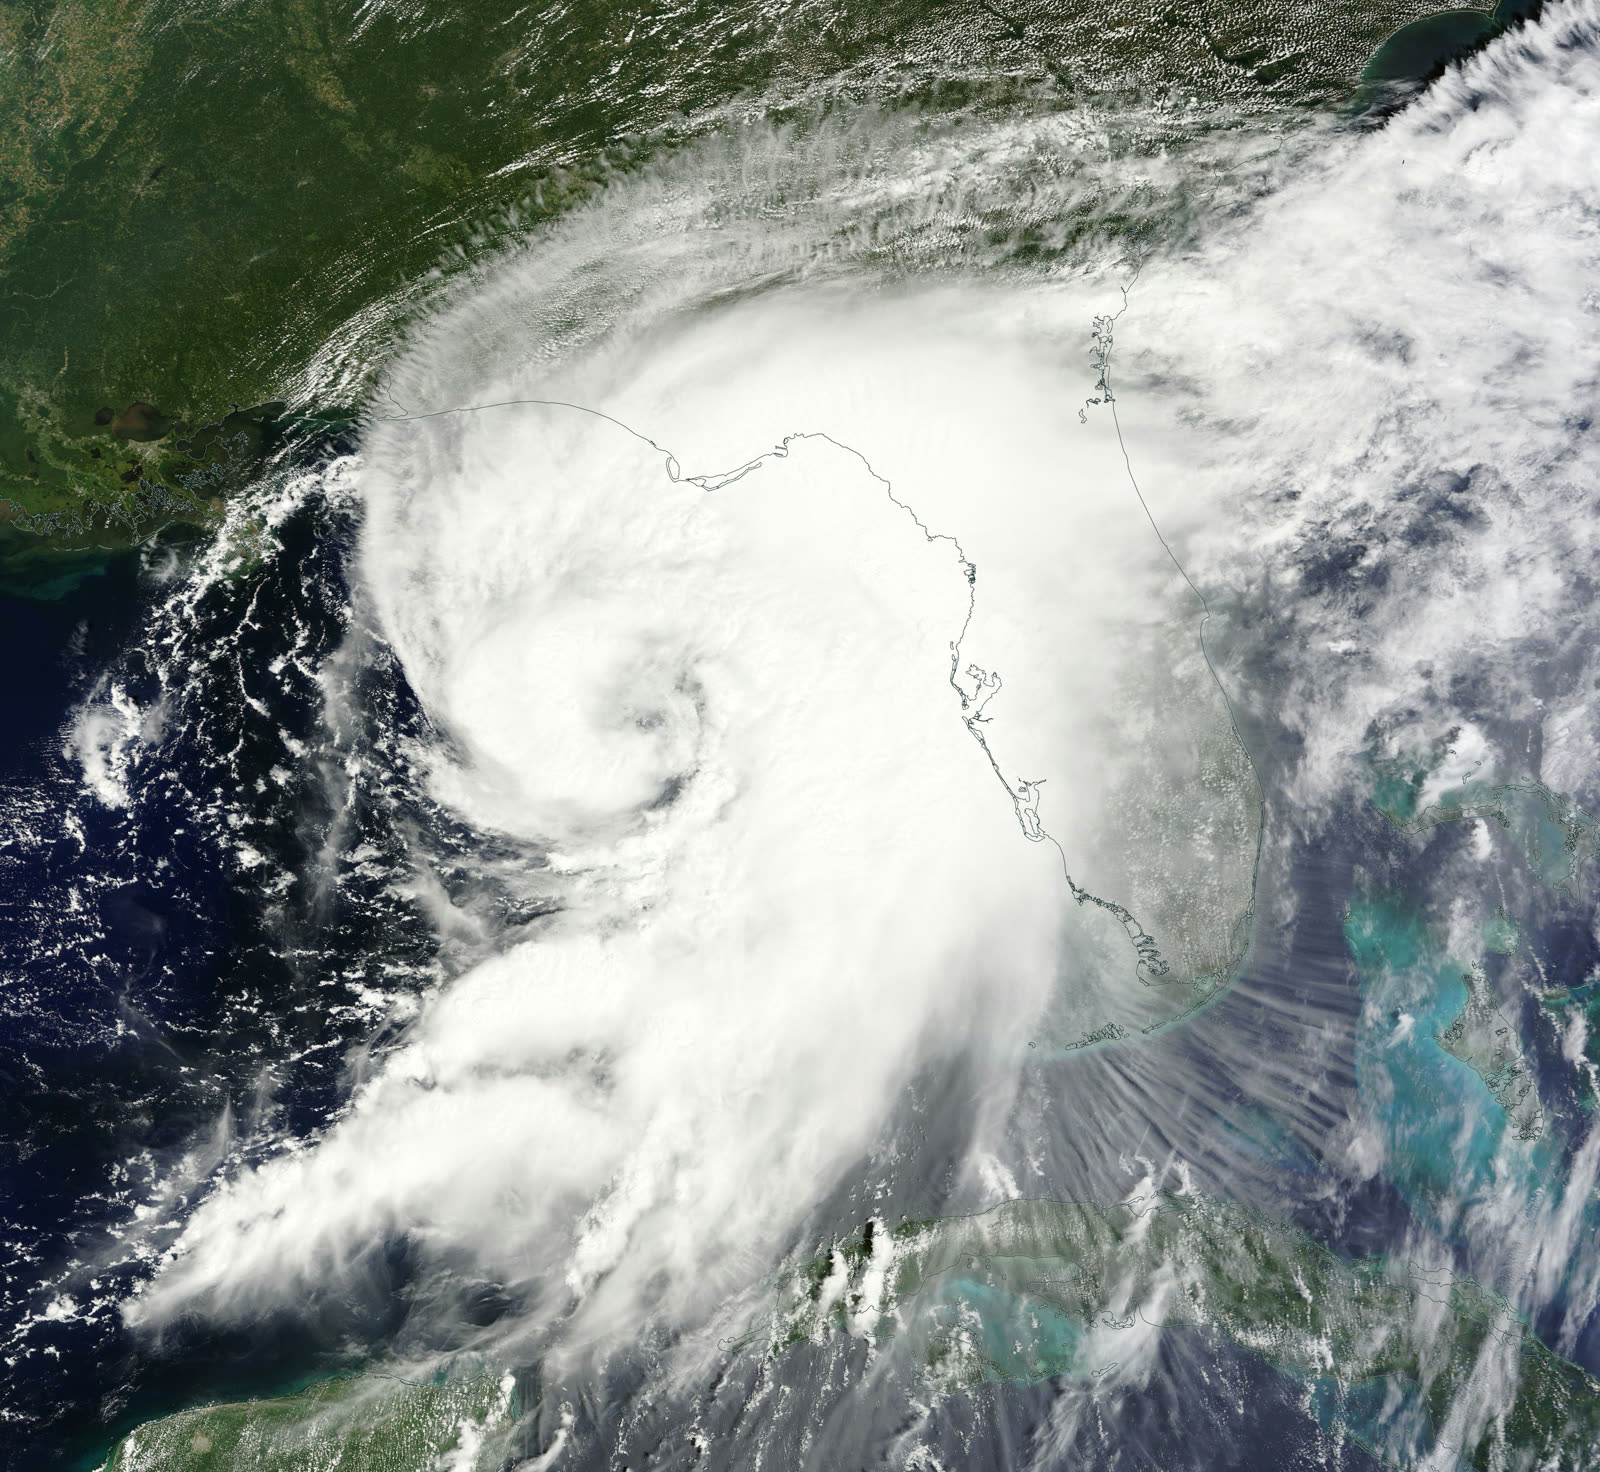
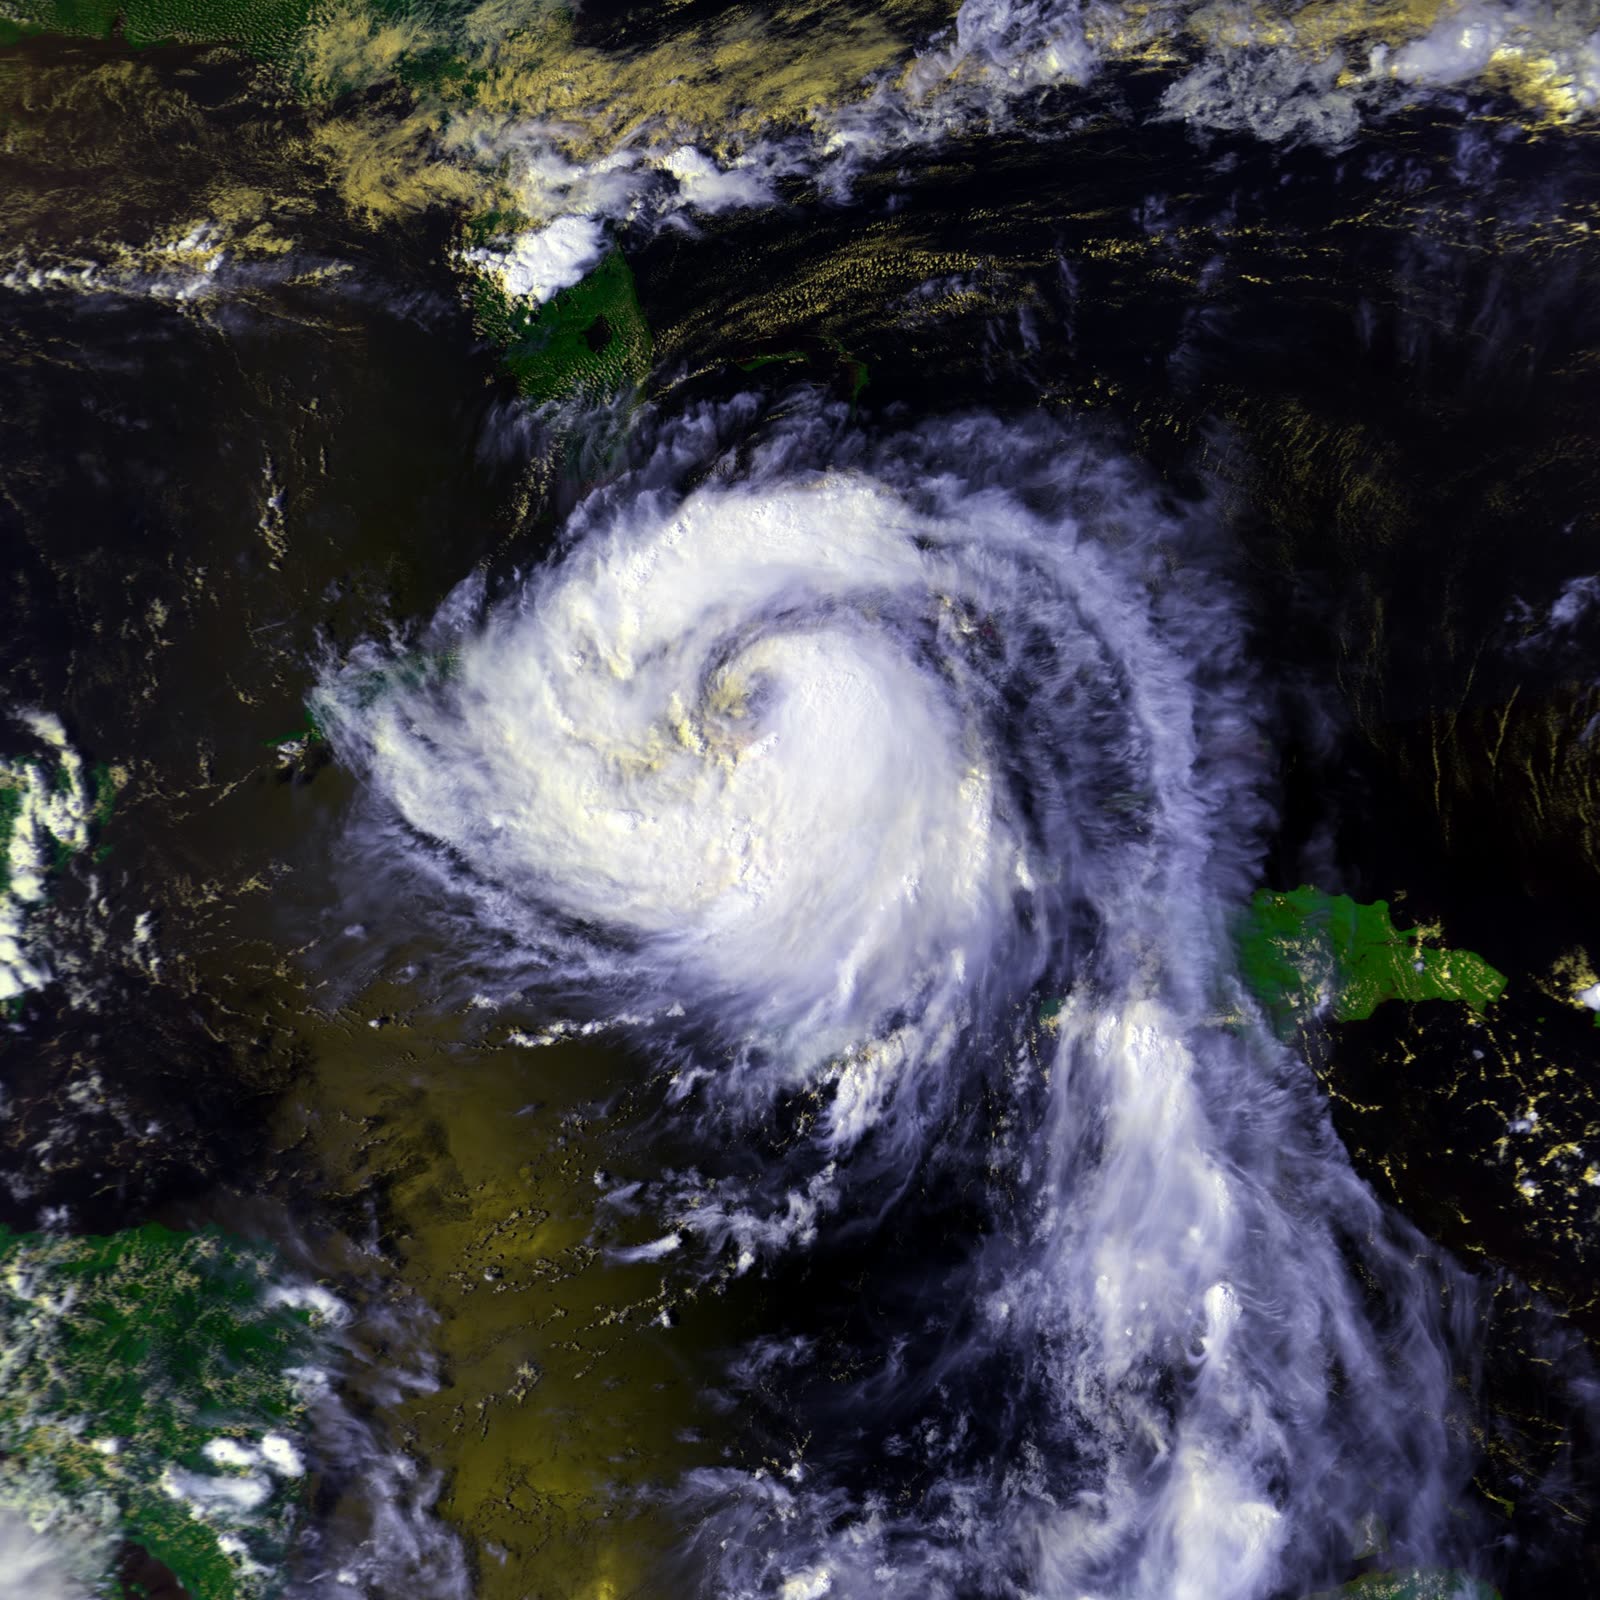
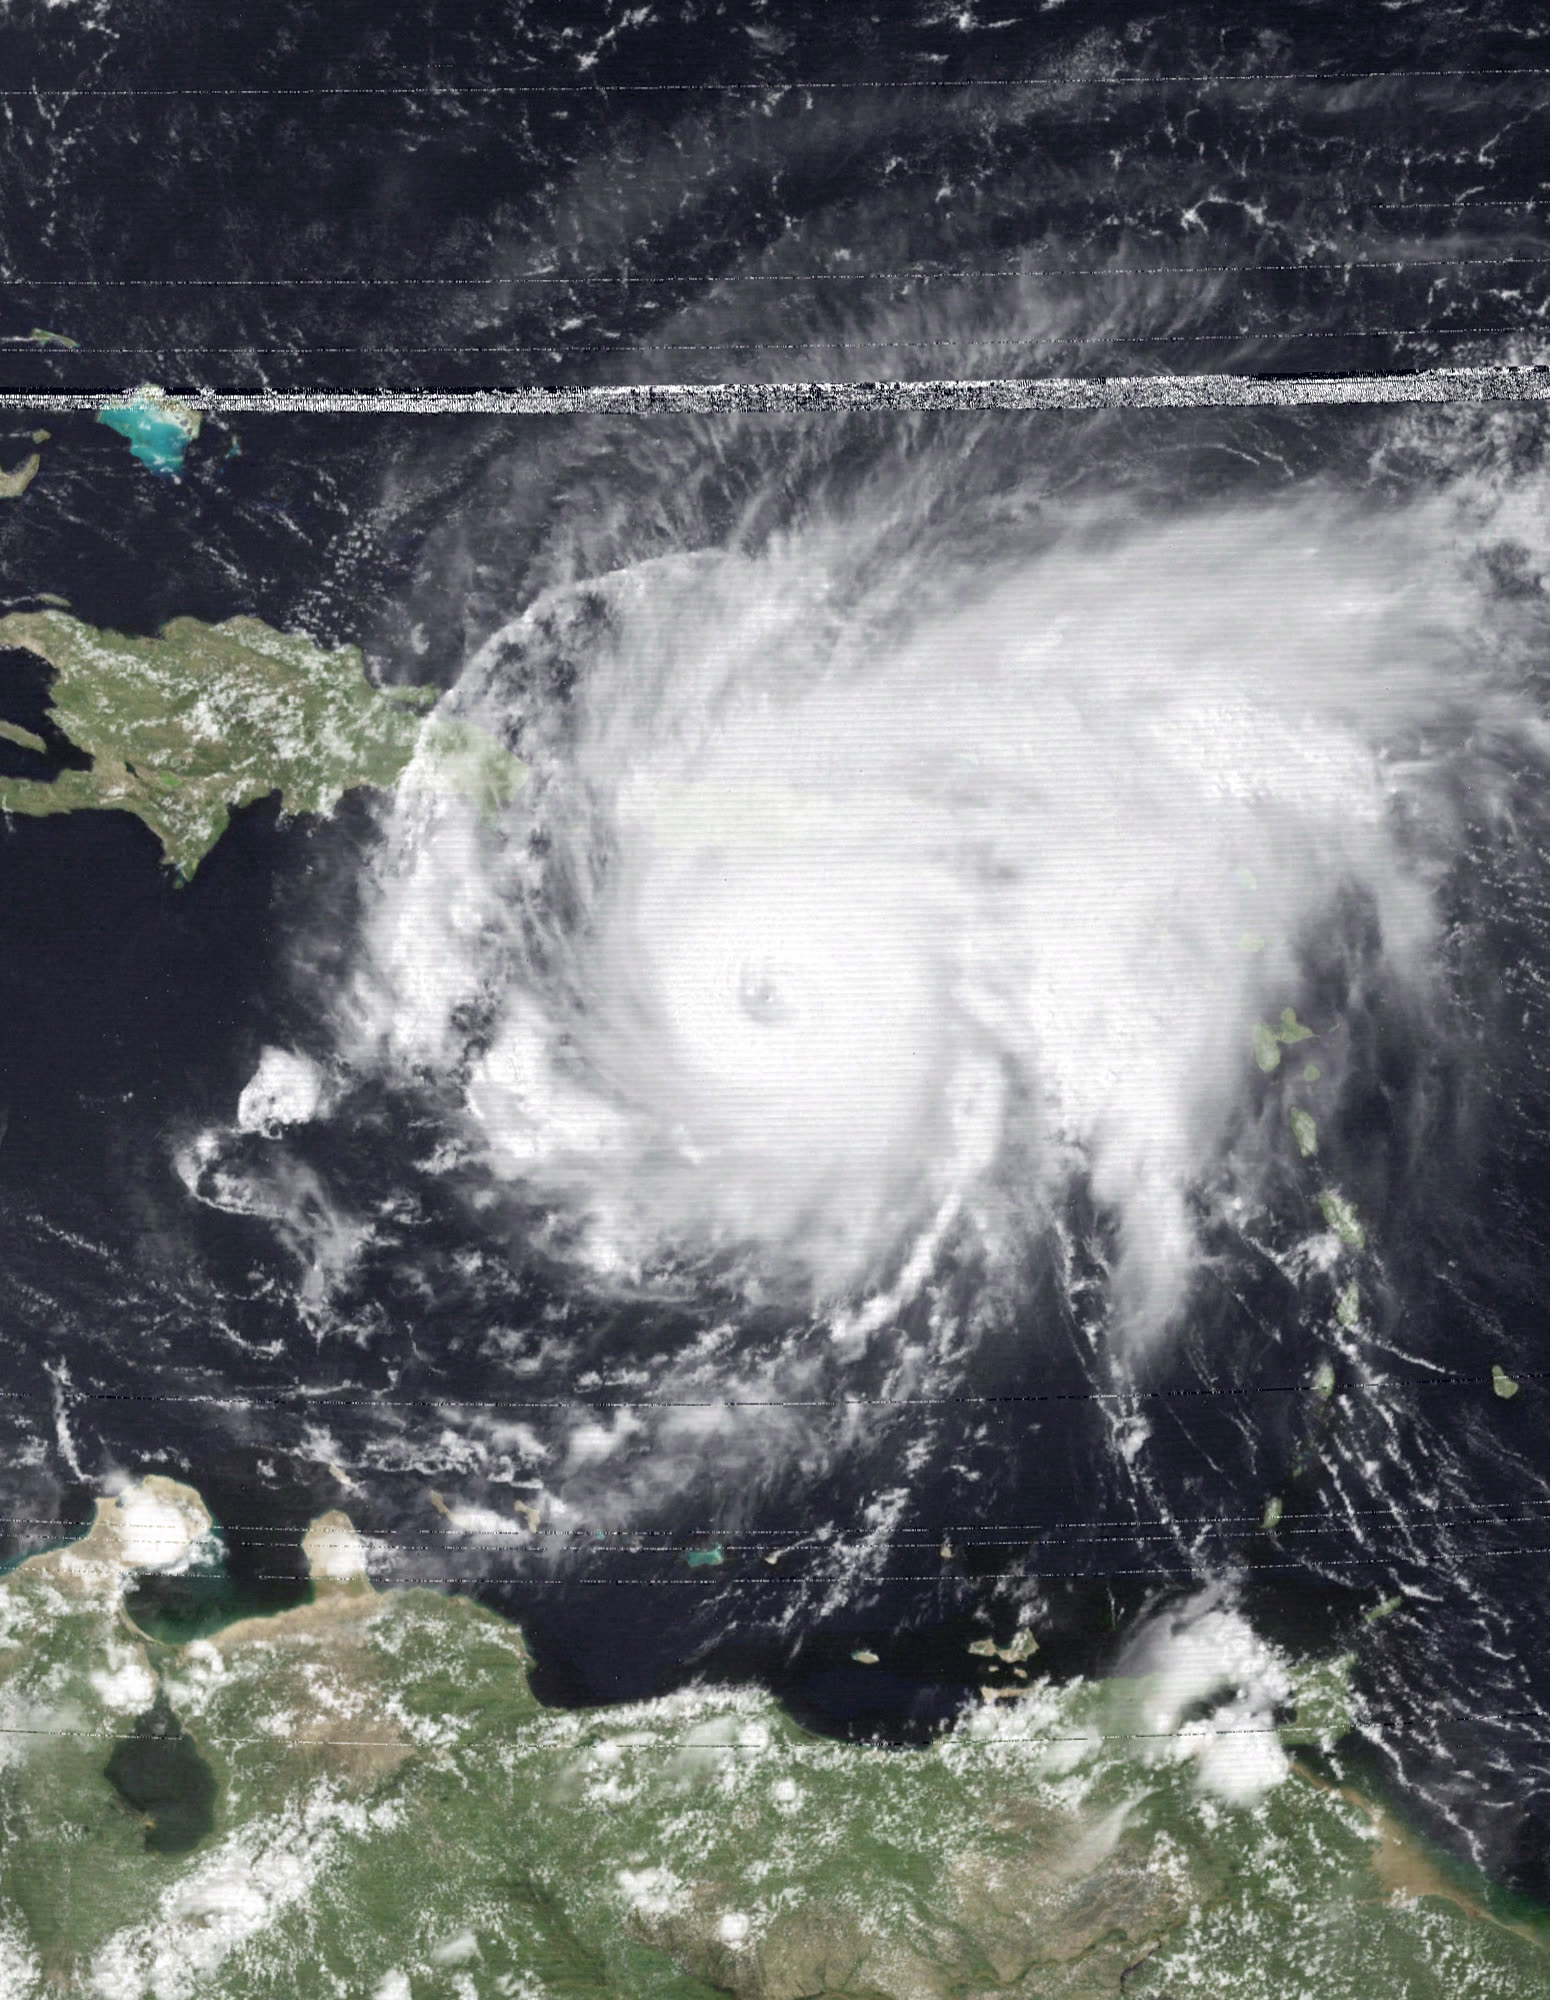
Hurricane Debby
CAT 1 · 80 MPH 29.7°N 83.4°W
Hurricane Debby
2024 · Steinhatchee, FL

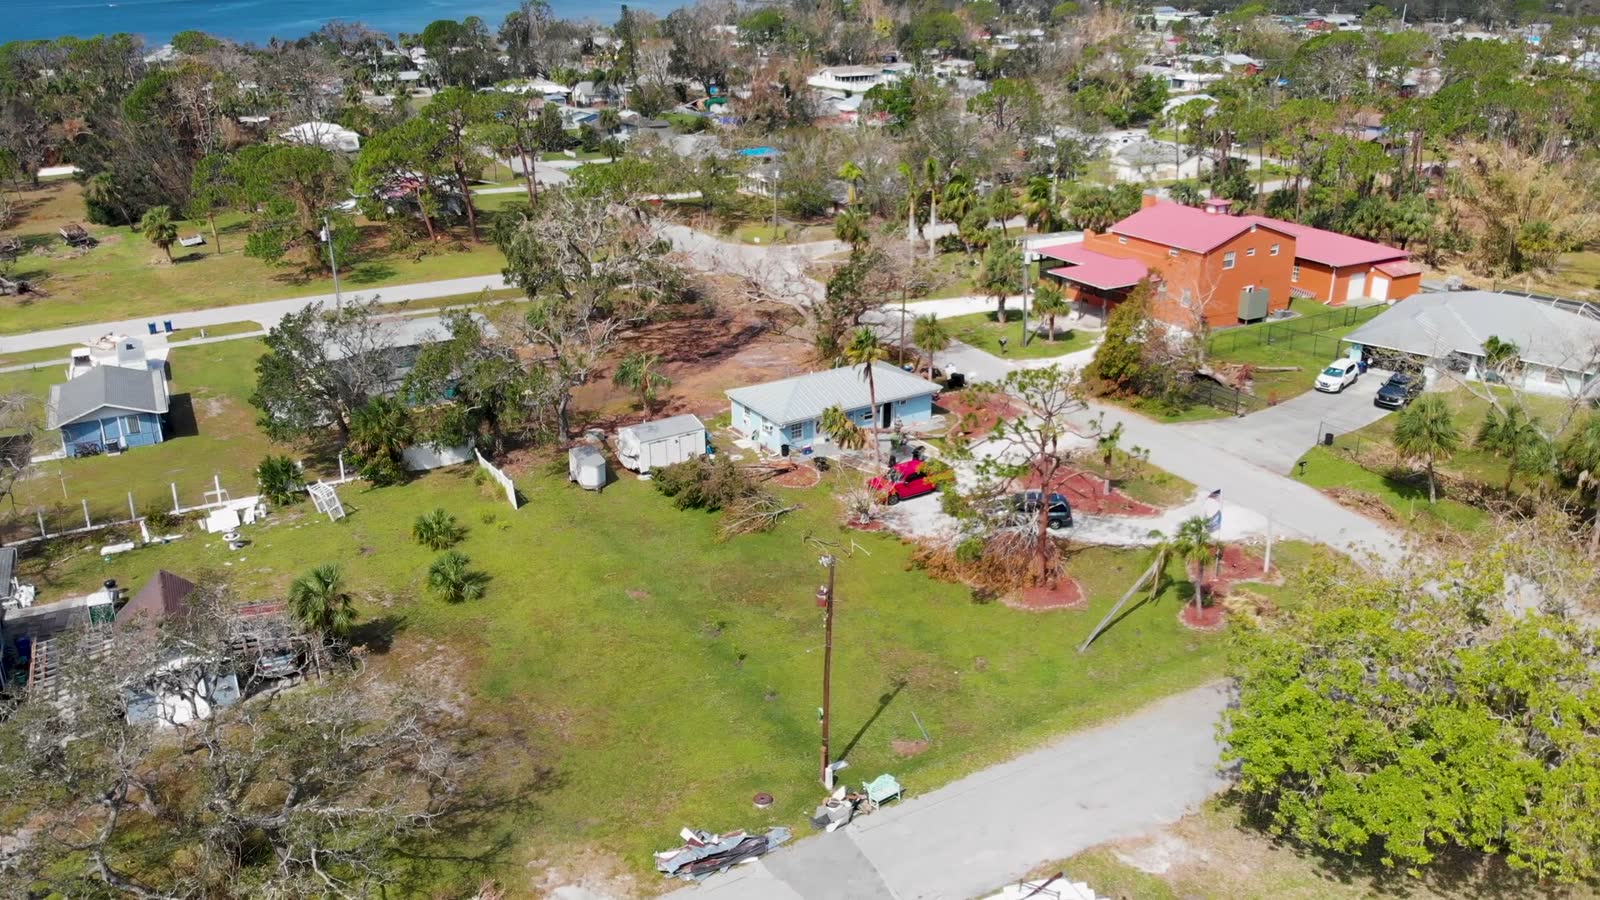
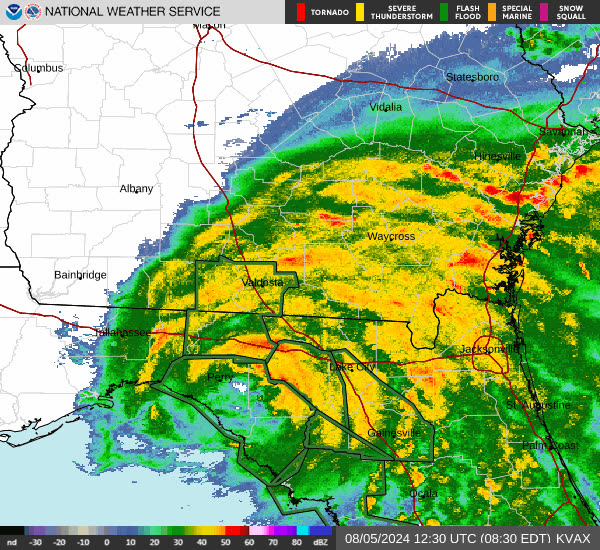
Debby's wind was a footnote — its stalled rain flooded Sarasota, Savannah, and the SC Lowcountry, and most of that water hit homes with no flood policy

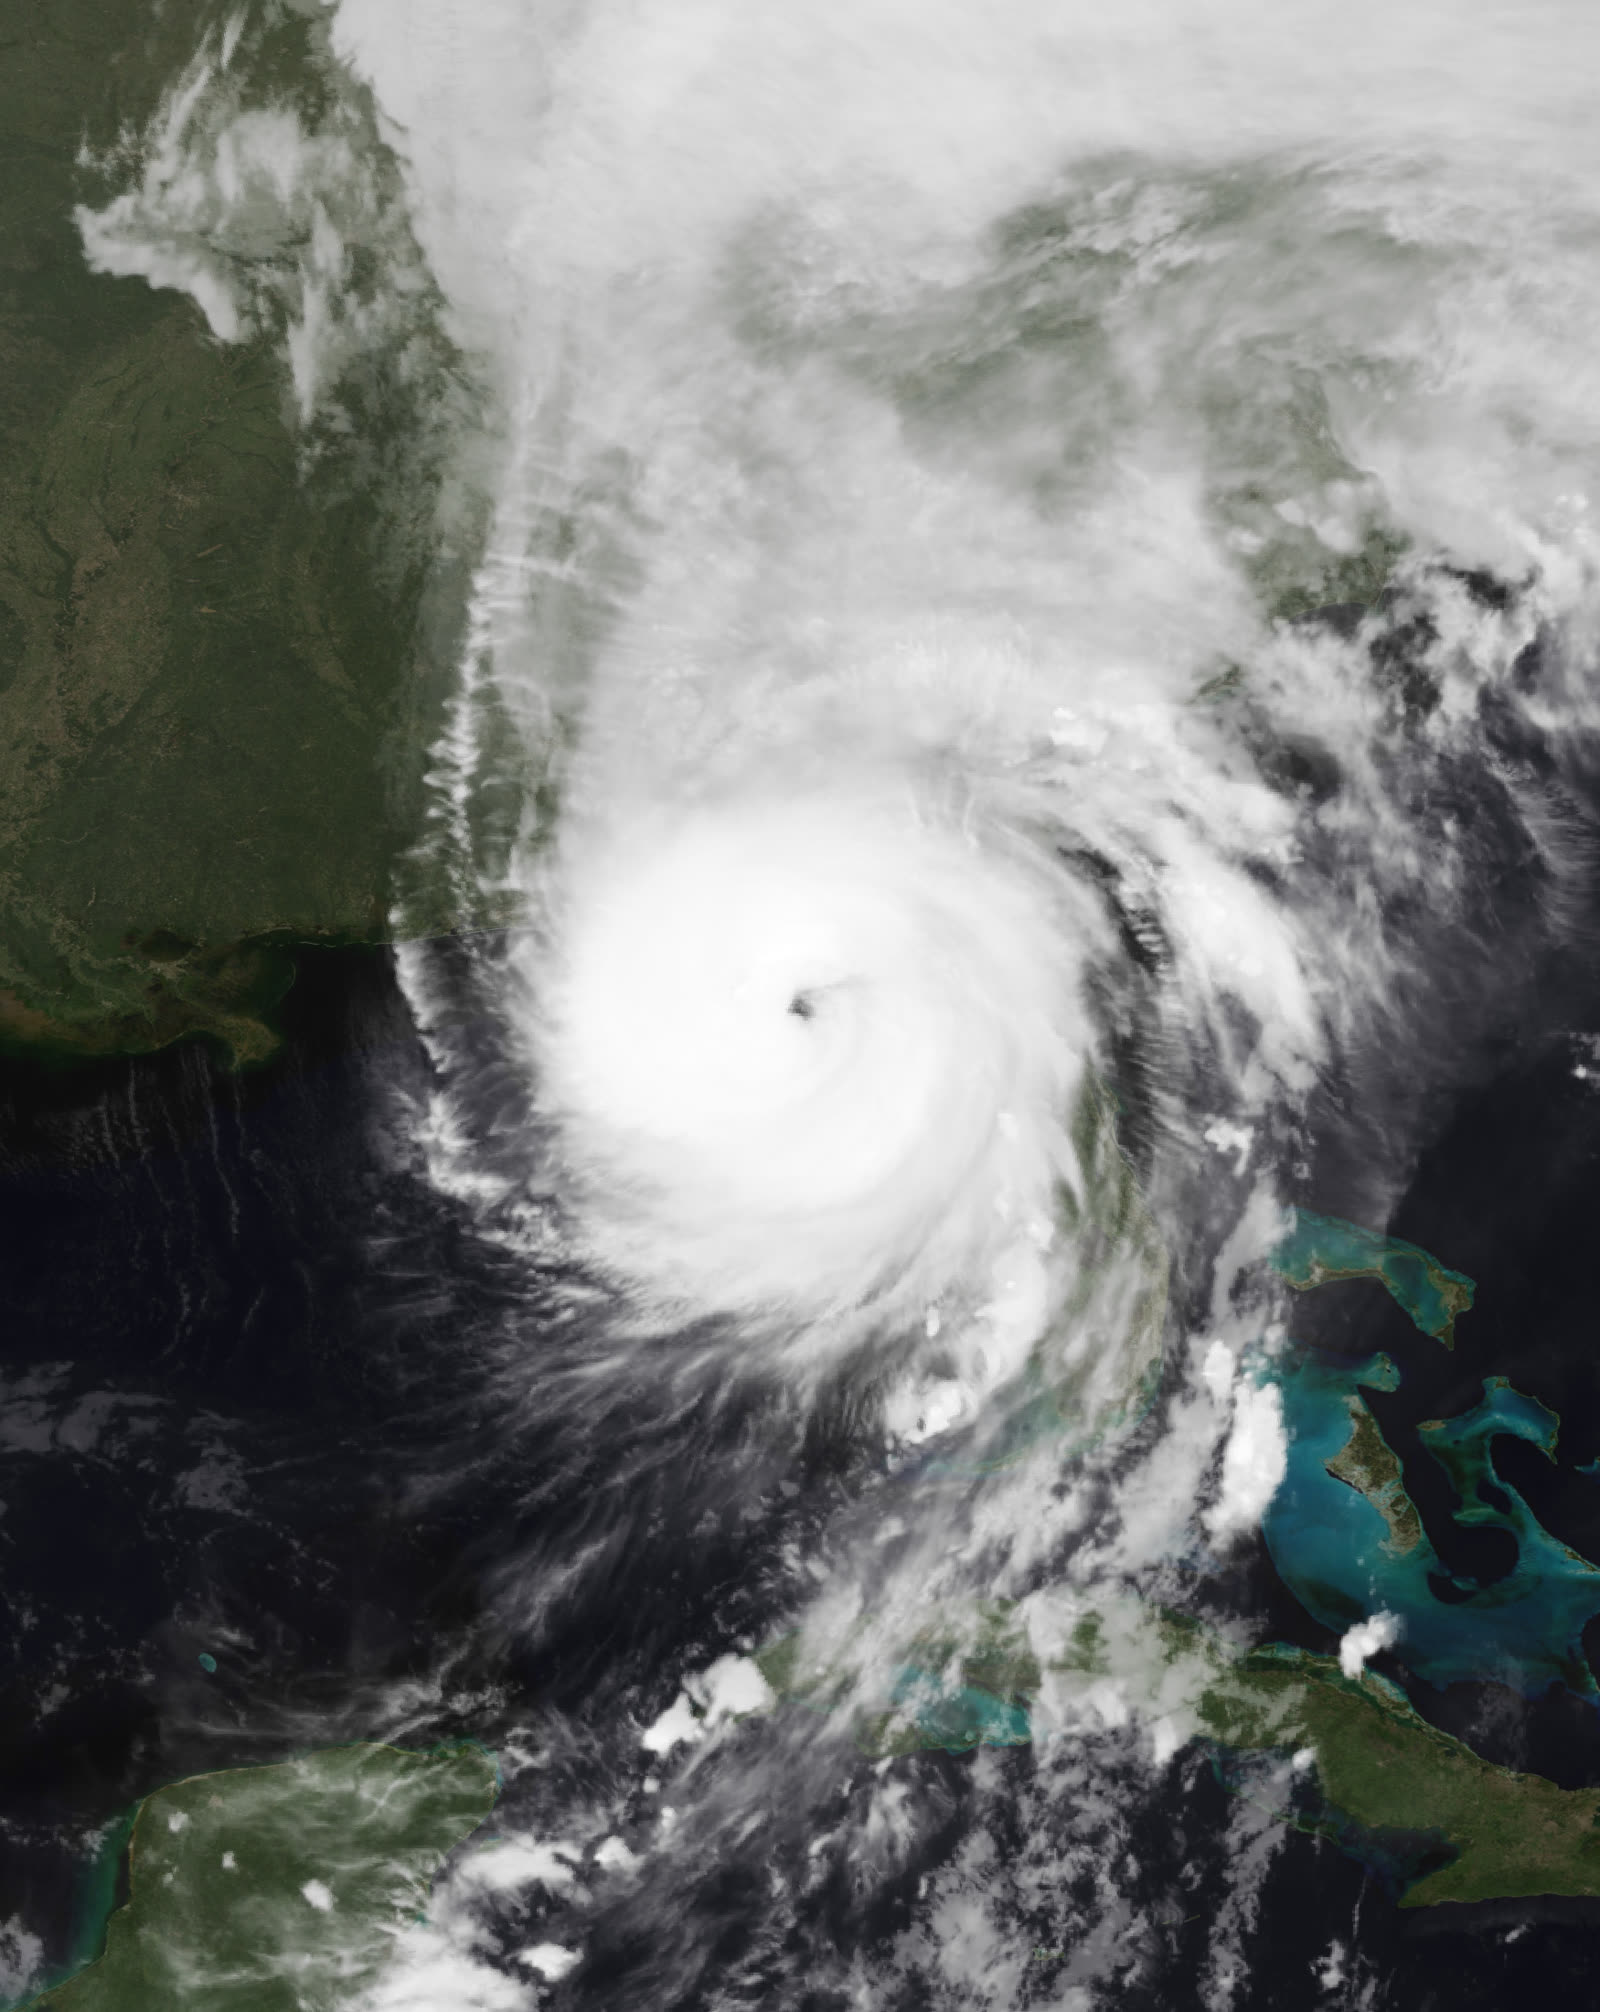
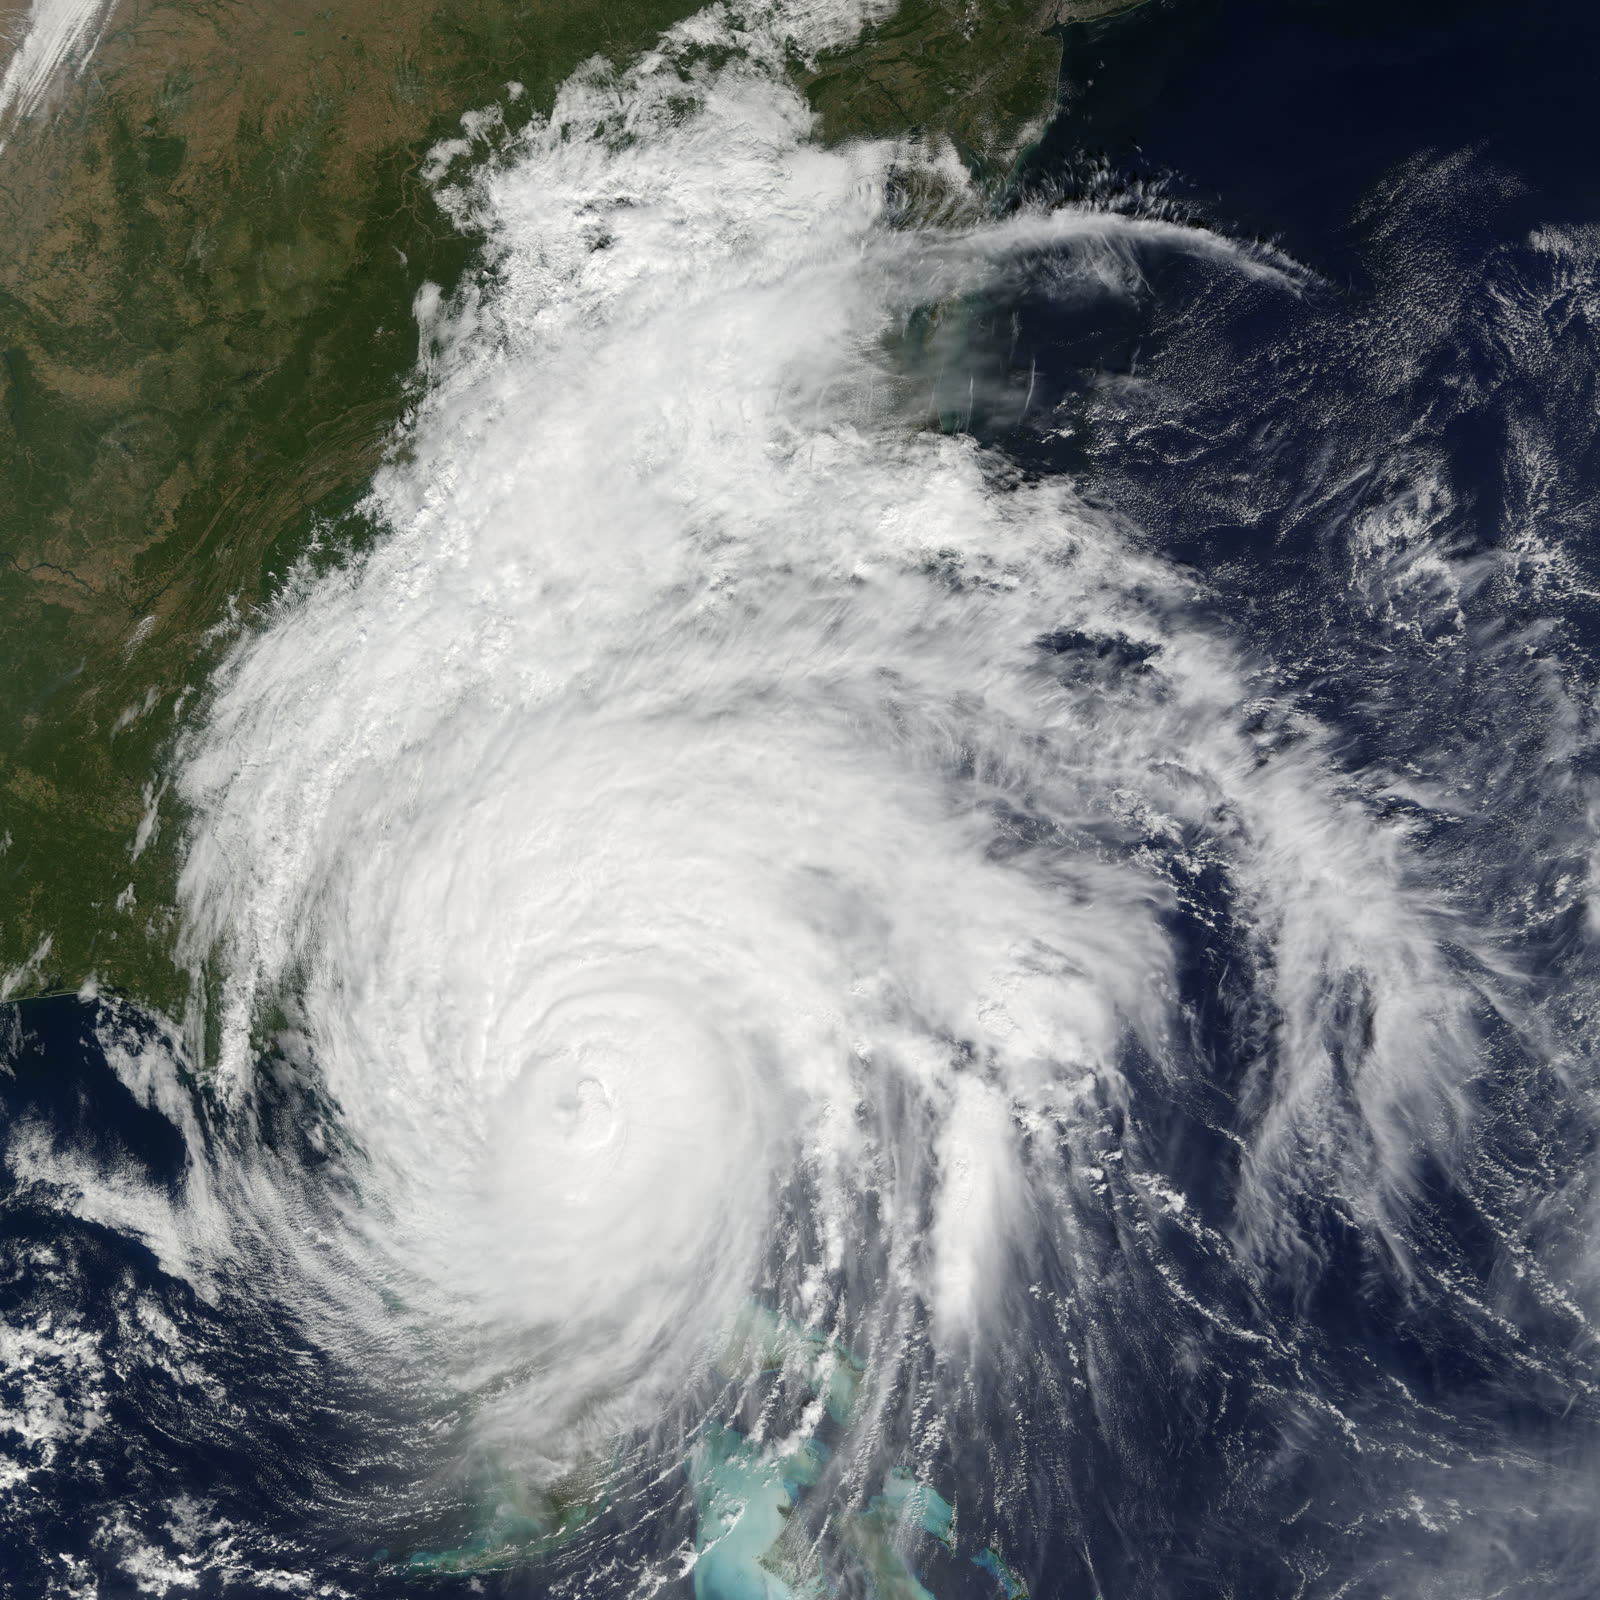
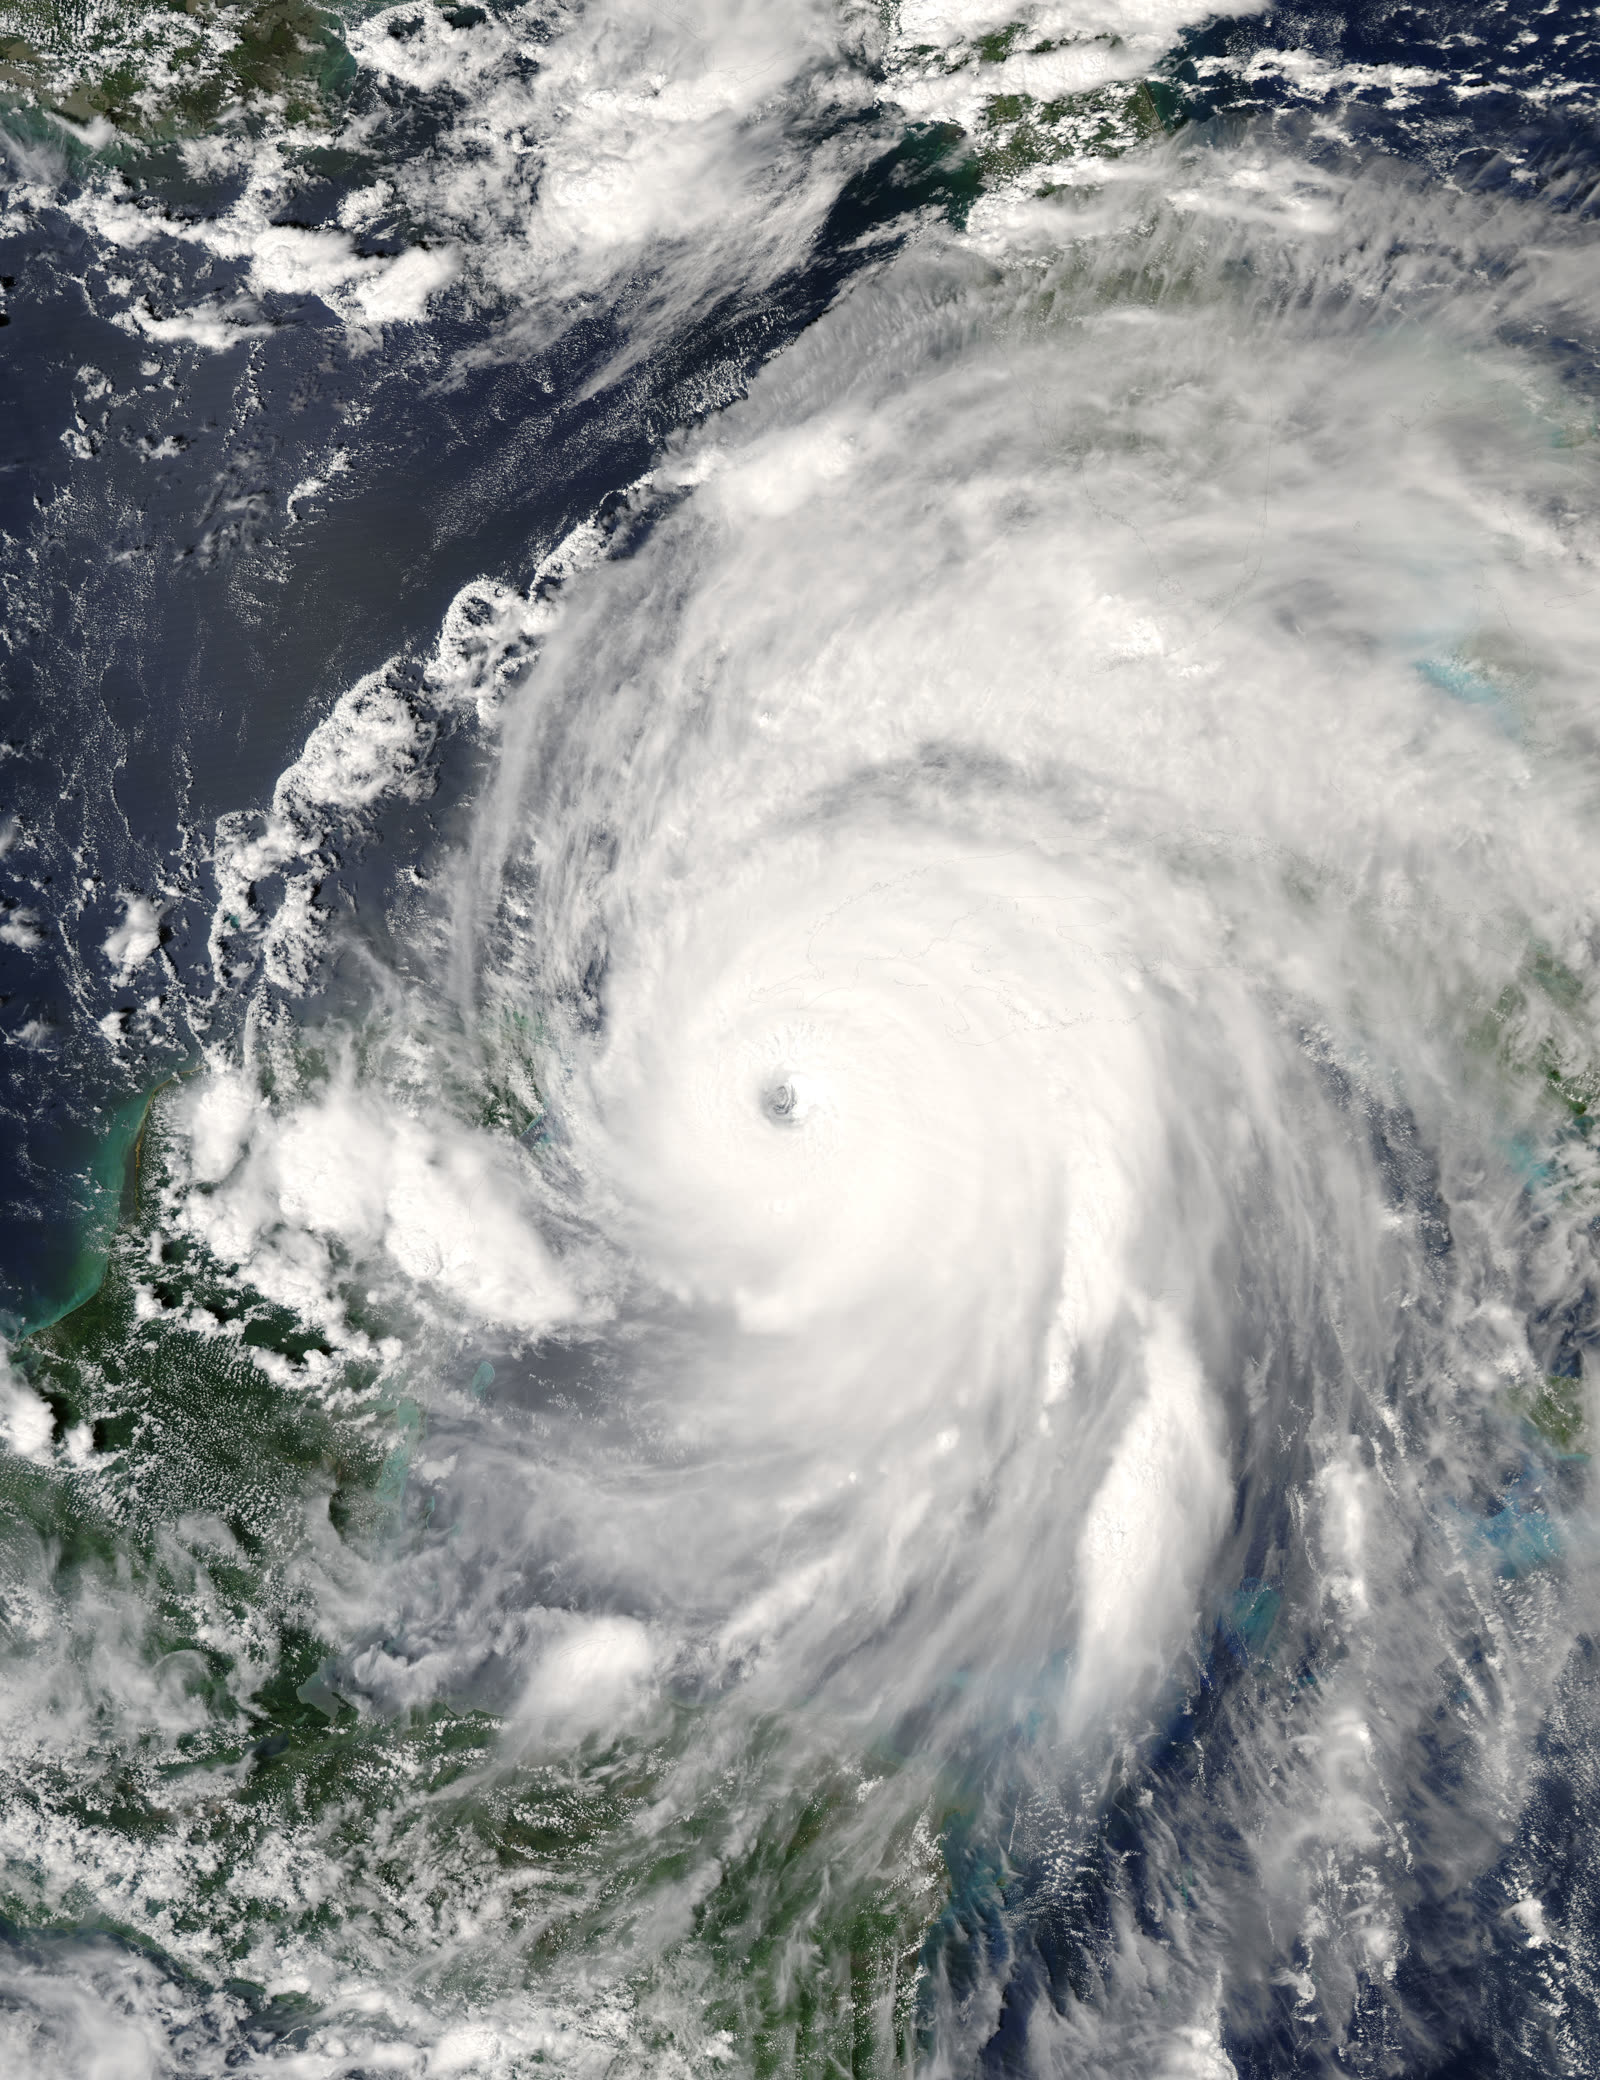
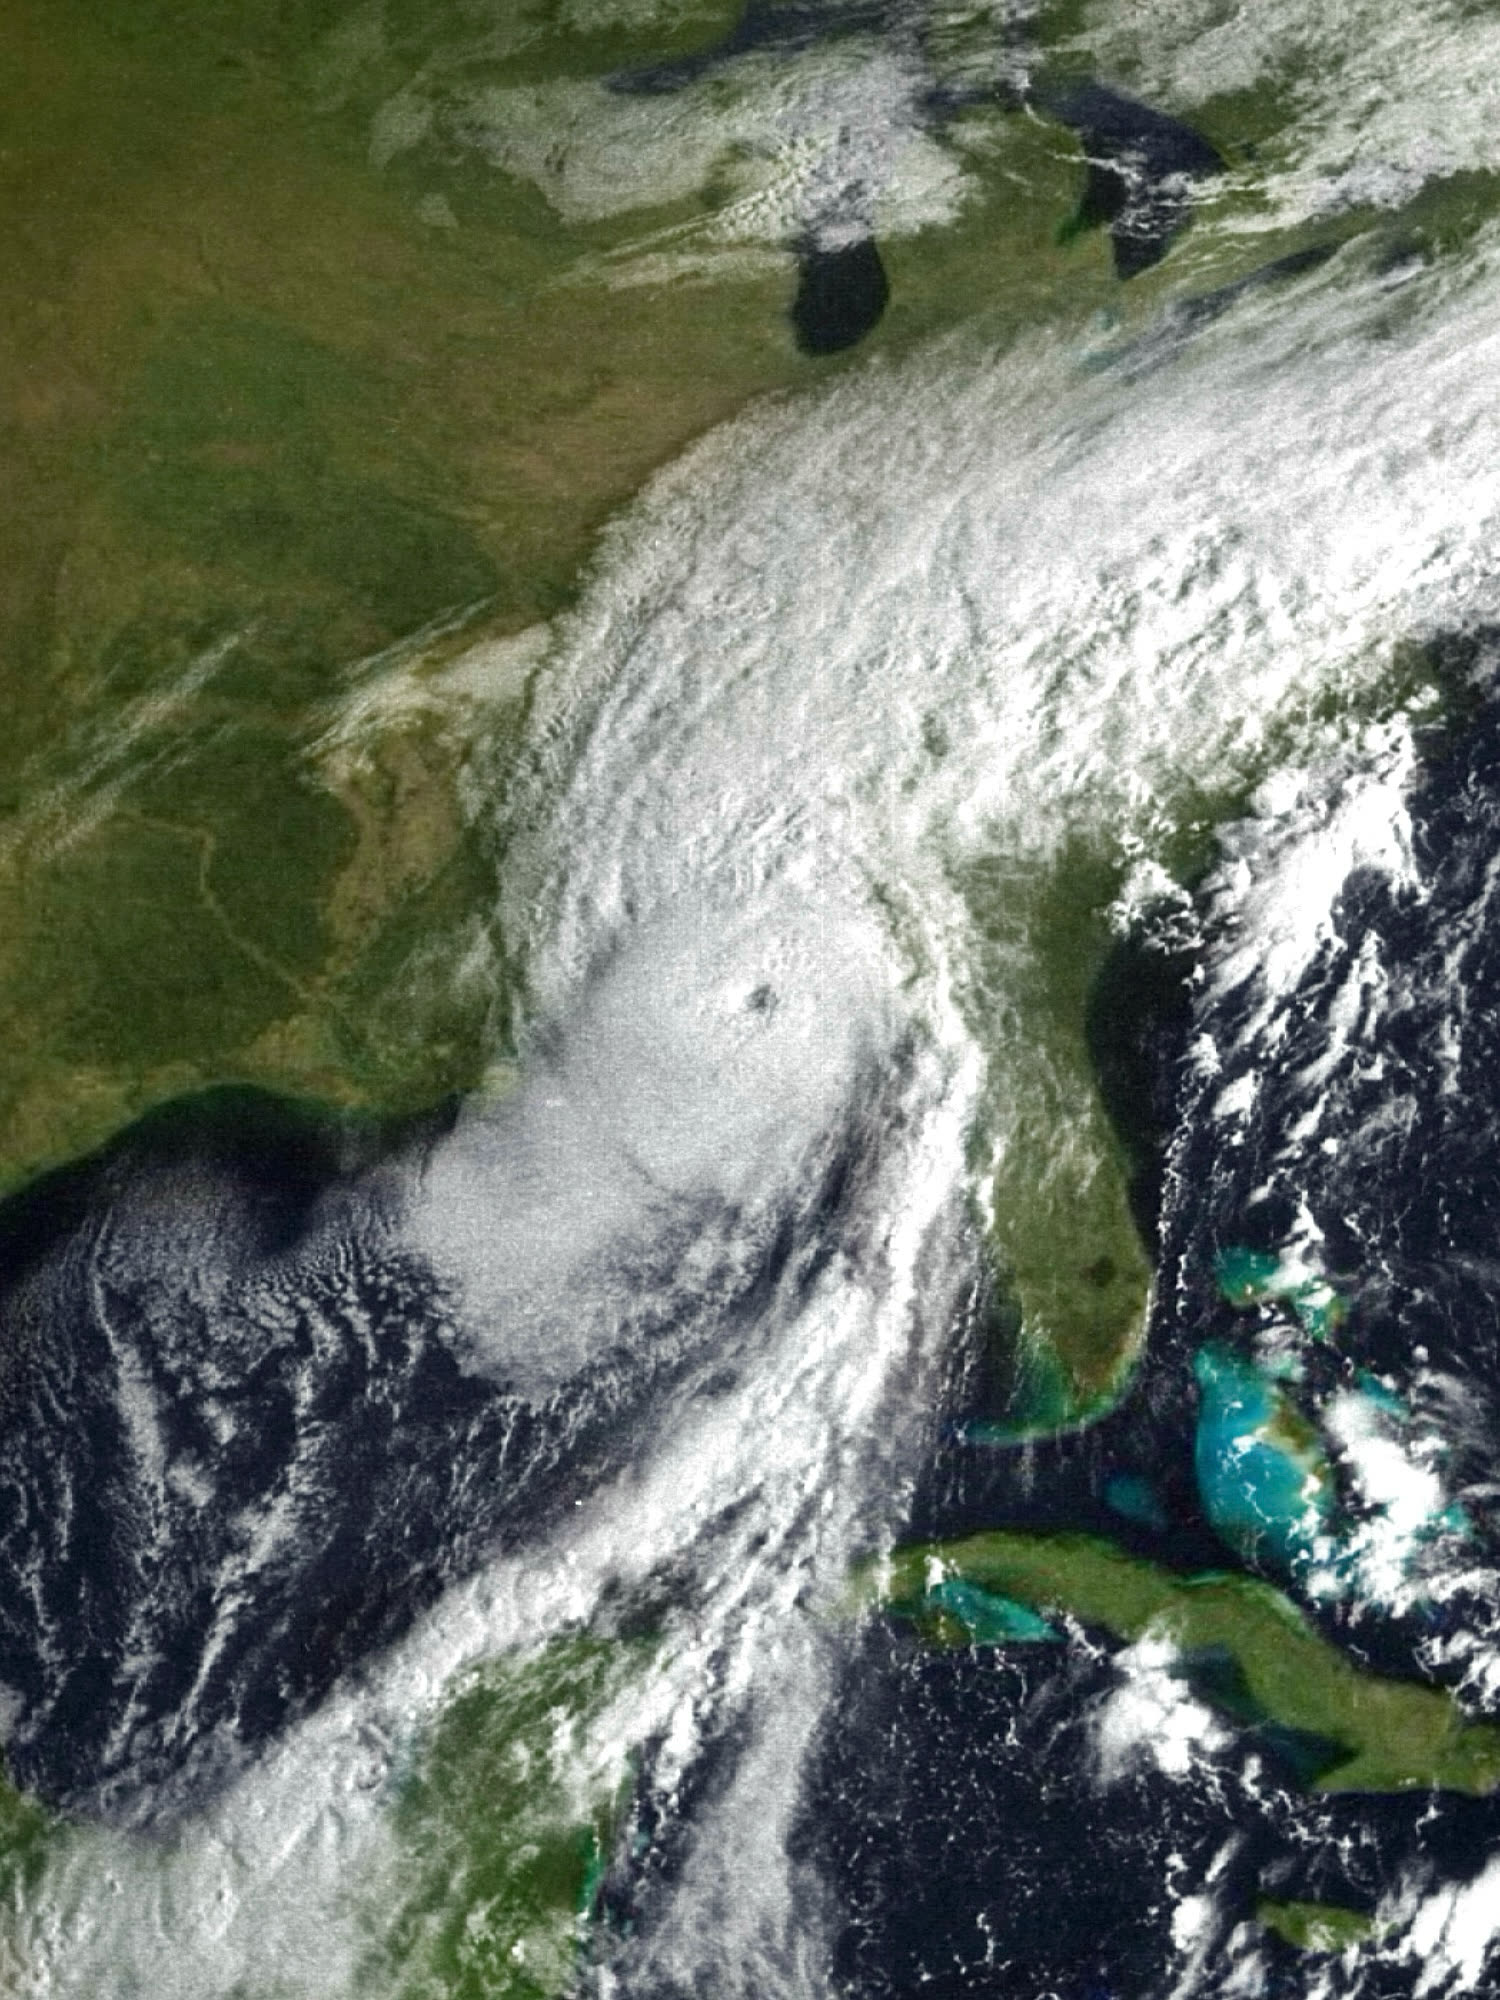
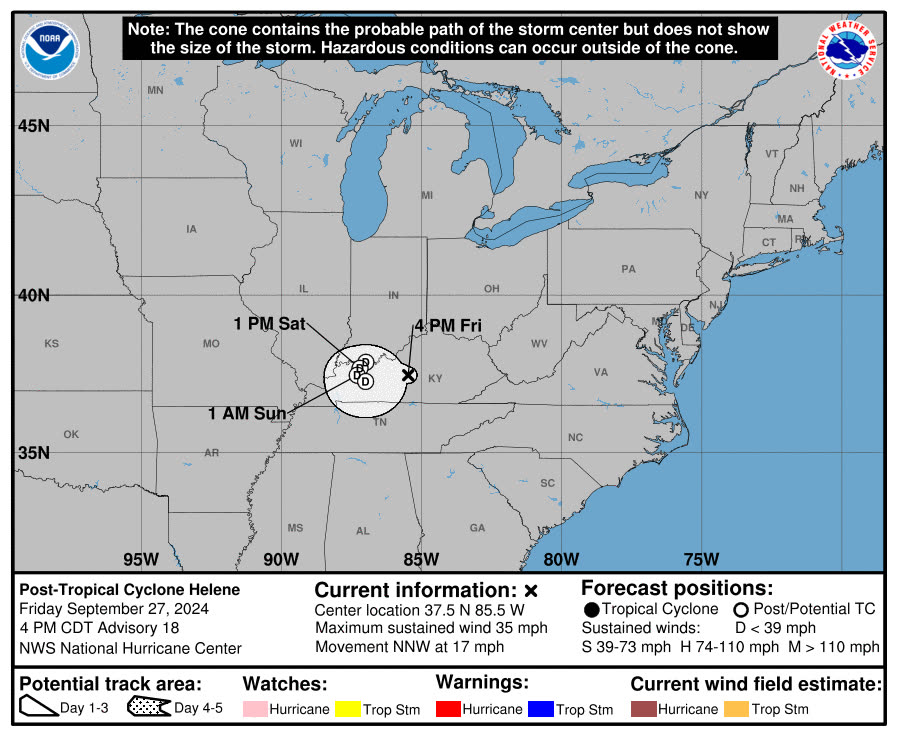
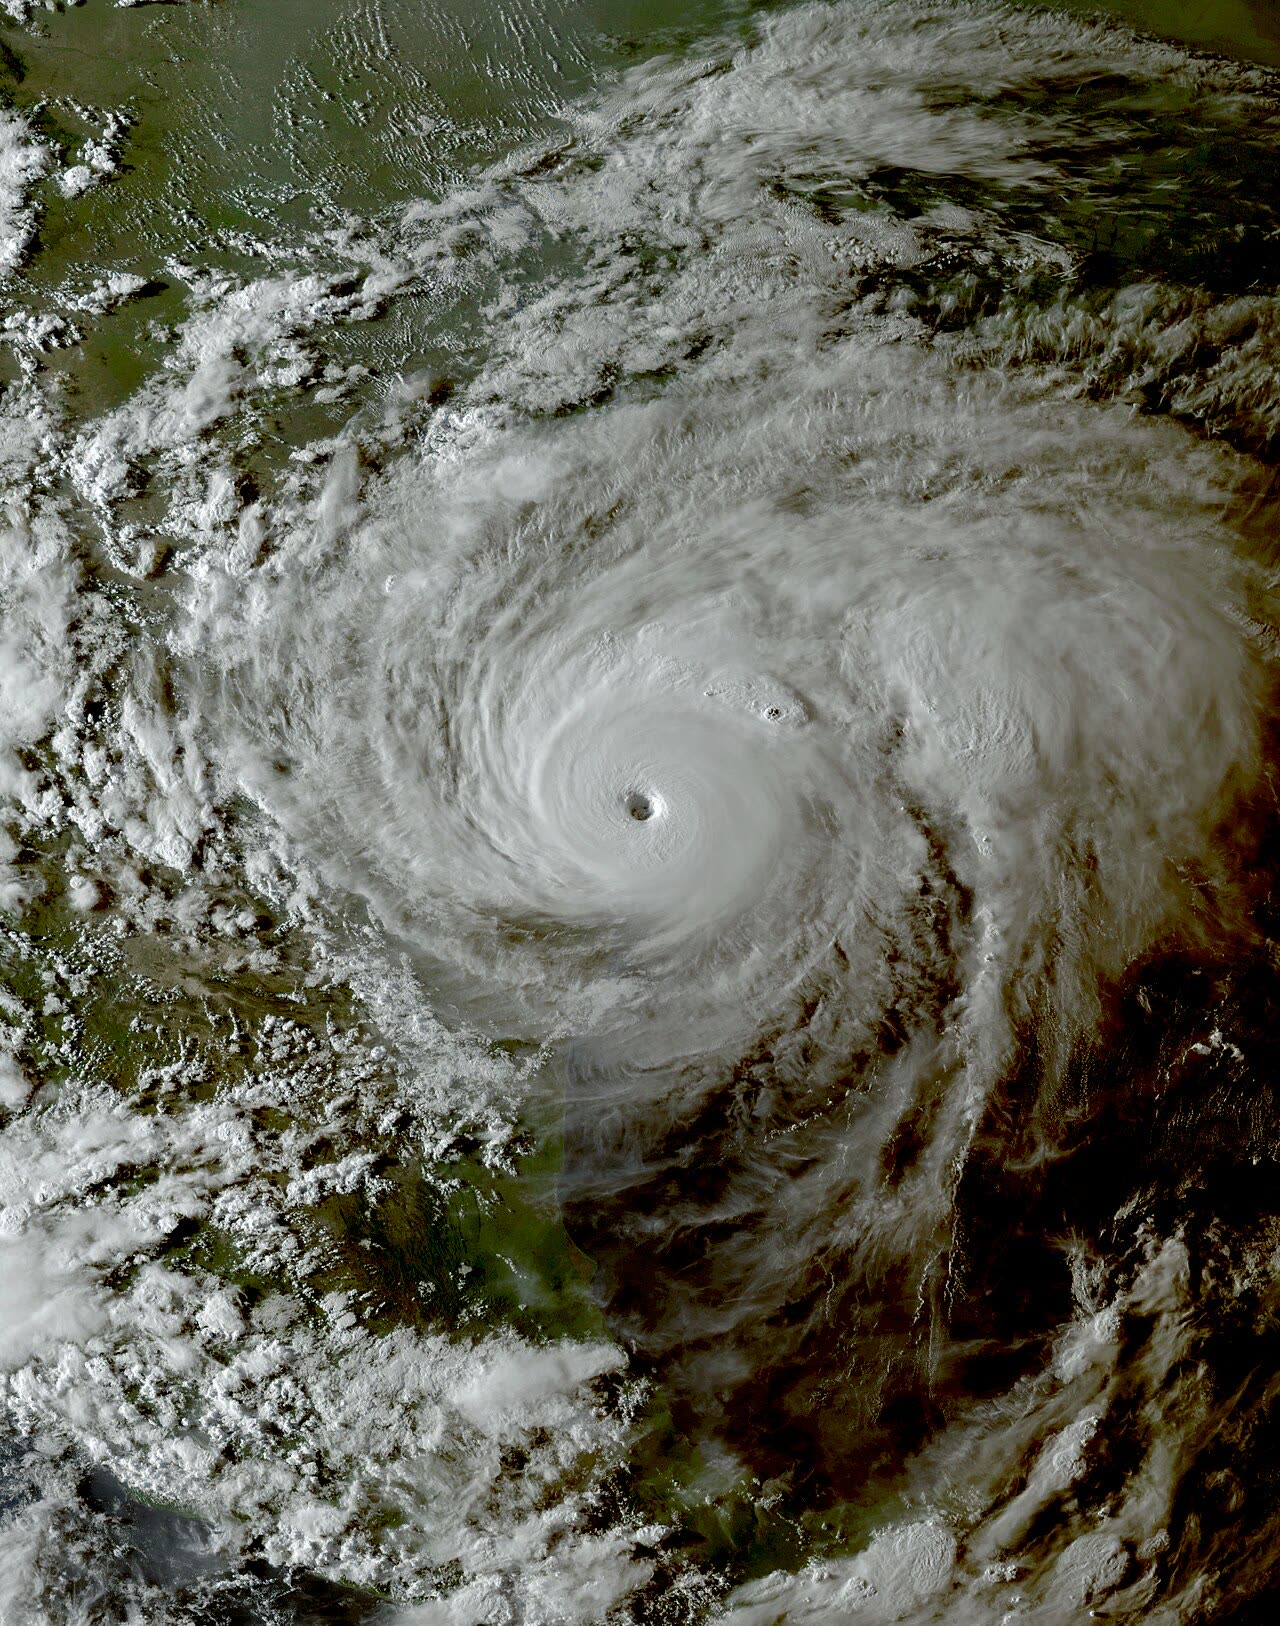
Hurricane Helene
CAT 4 · 140 MPH
Hurricane Helene
2024 · Big Bend, FL (near Perry)

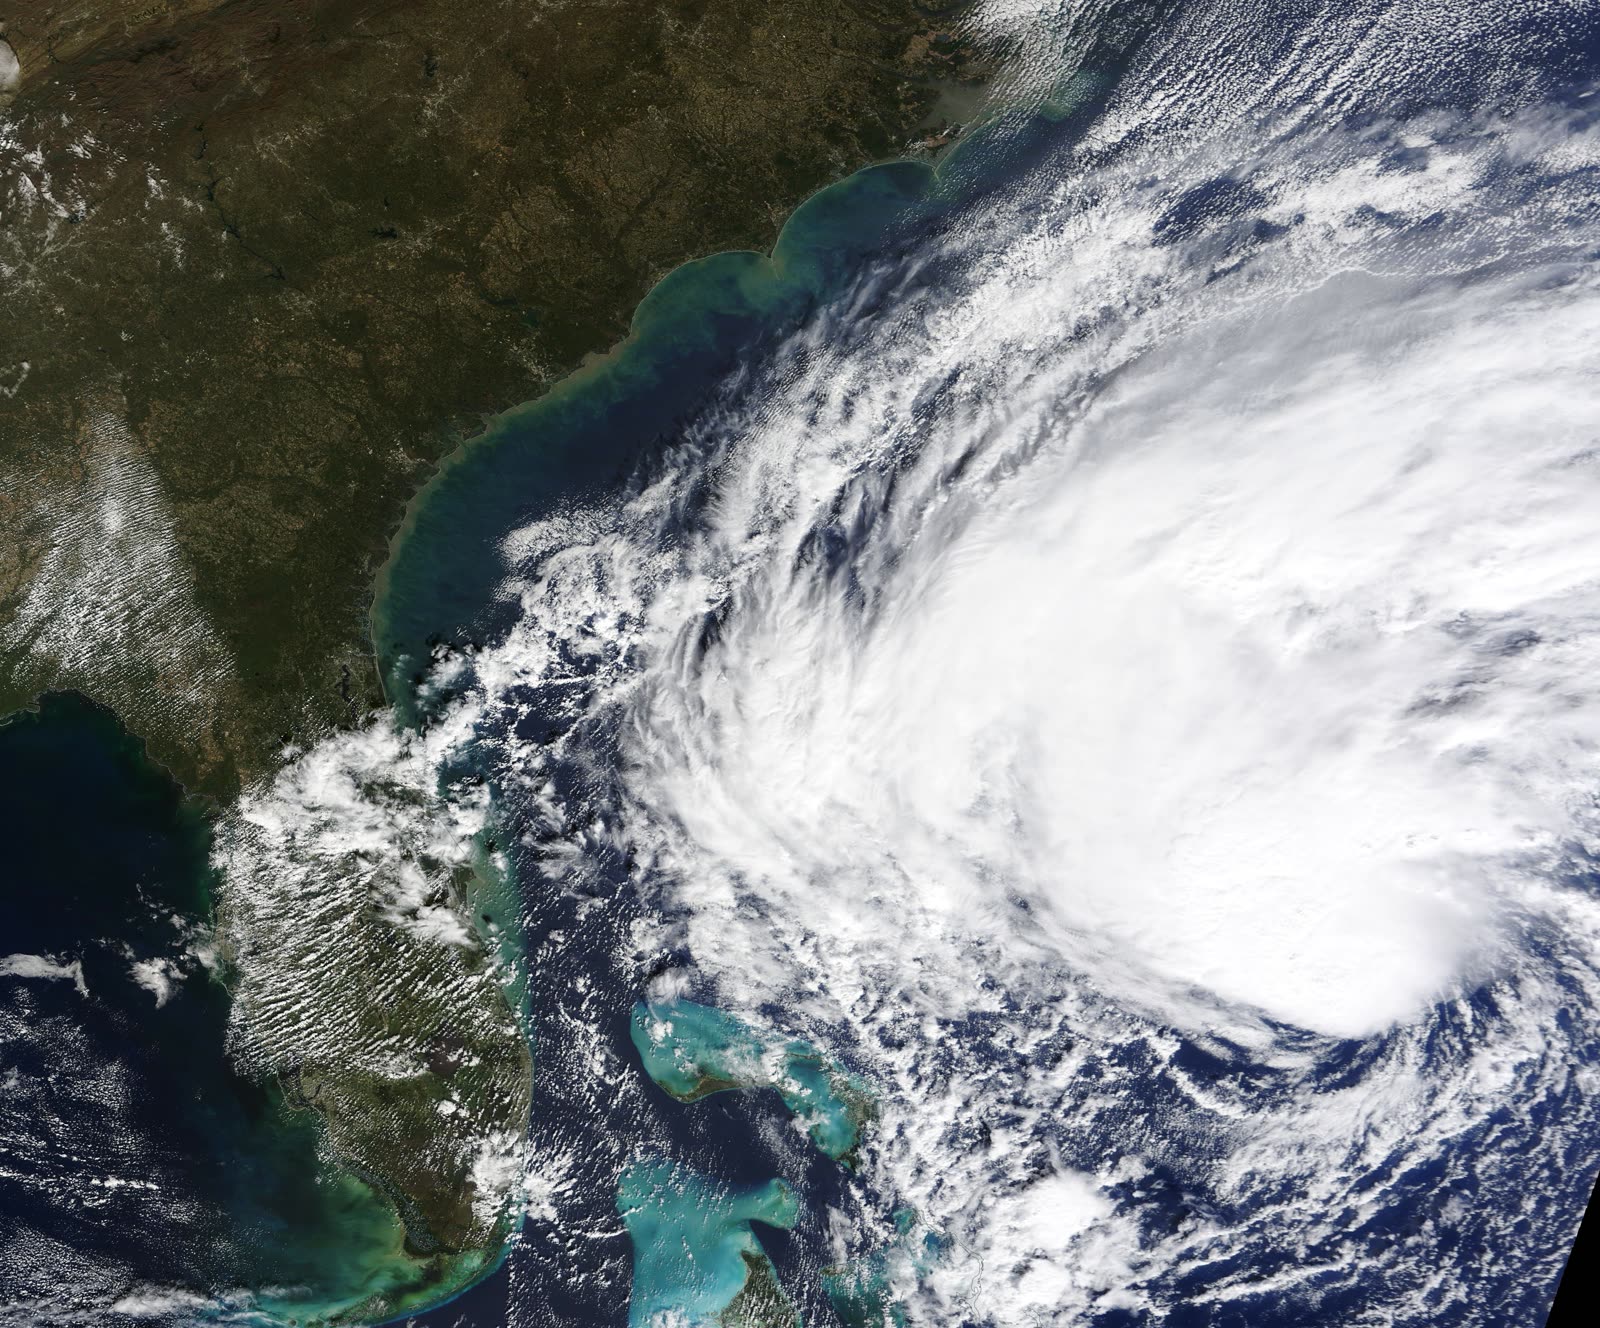
42% of Helene–Milton residential claims closed without payment — most flood losses had no flood policy behind them

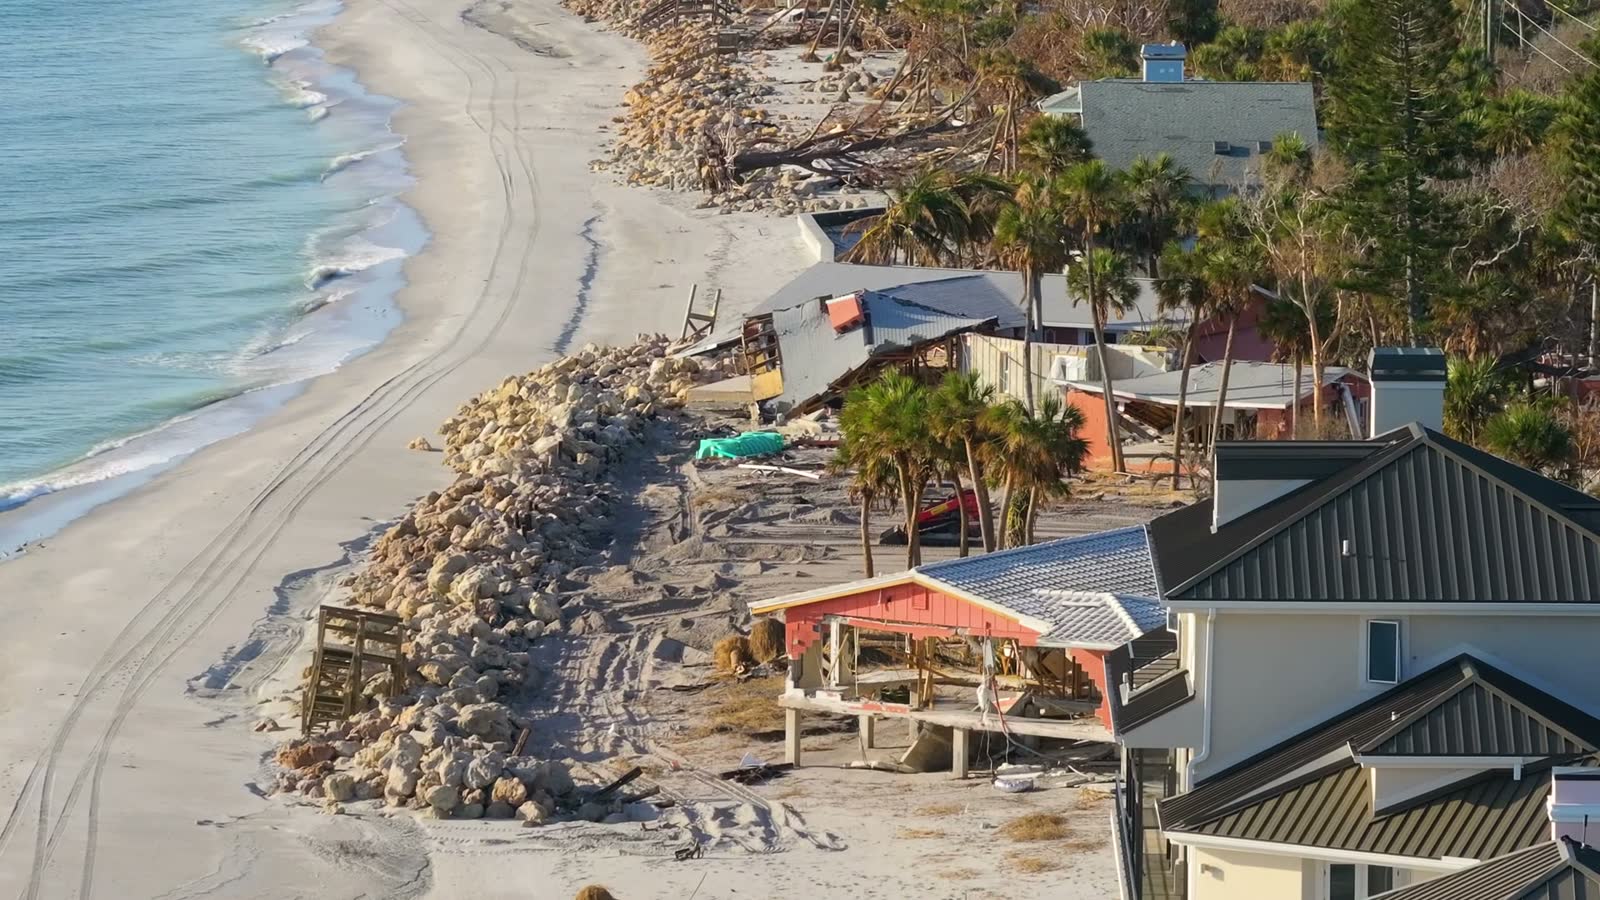
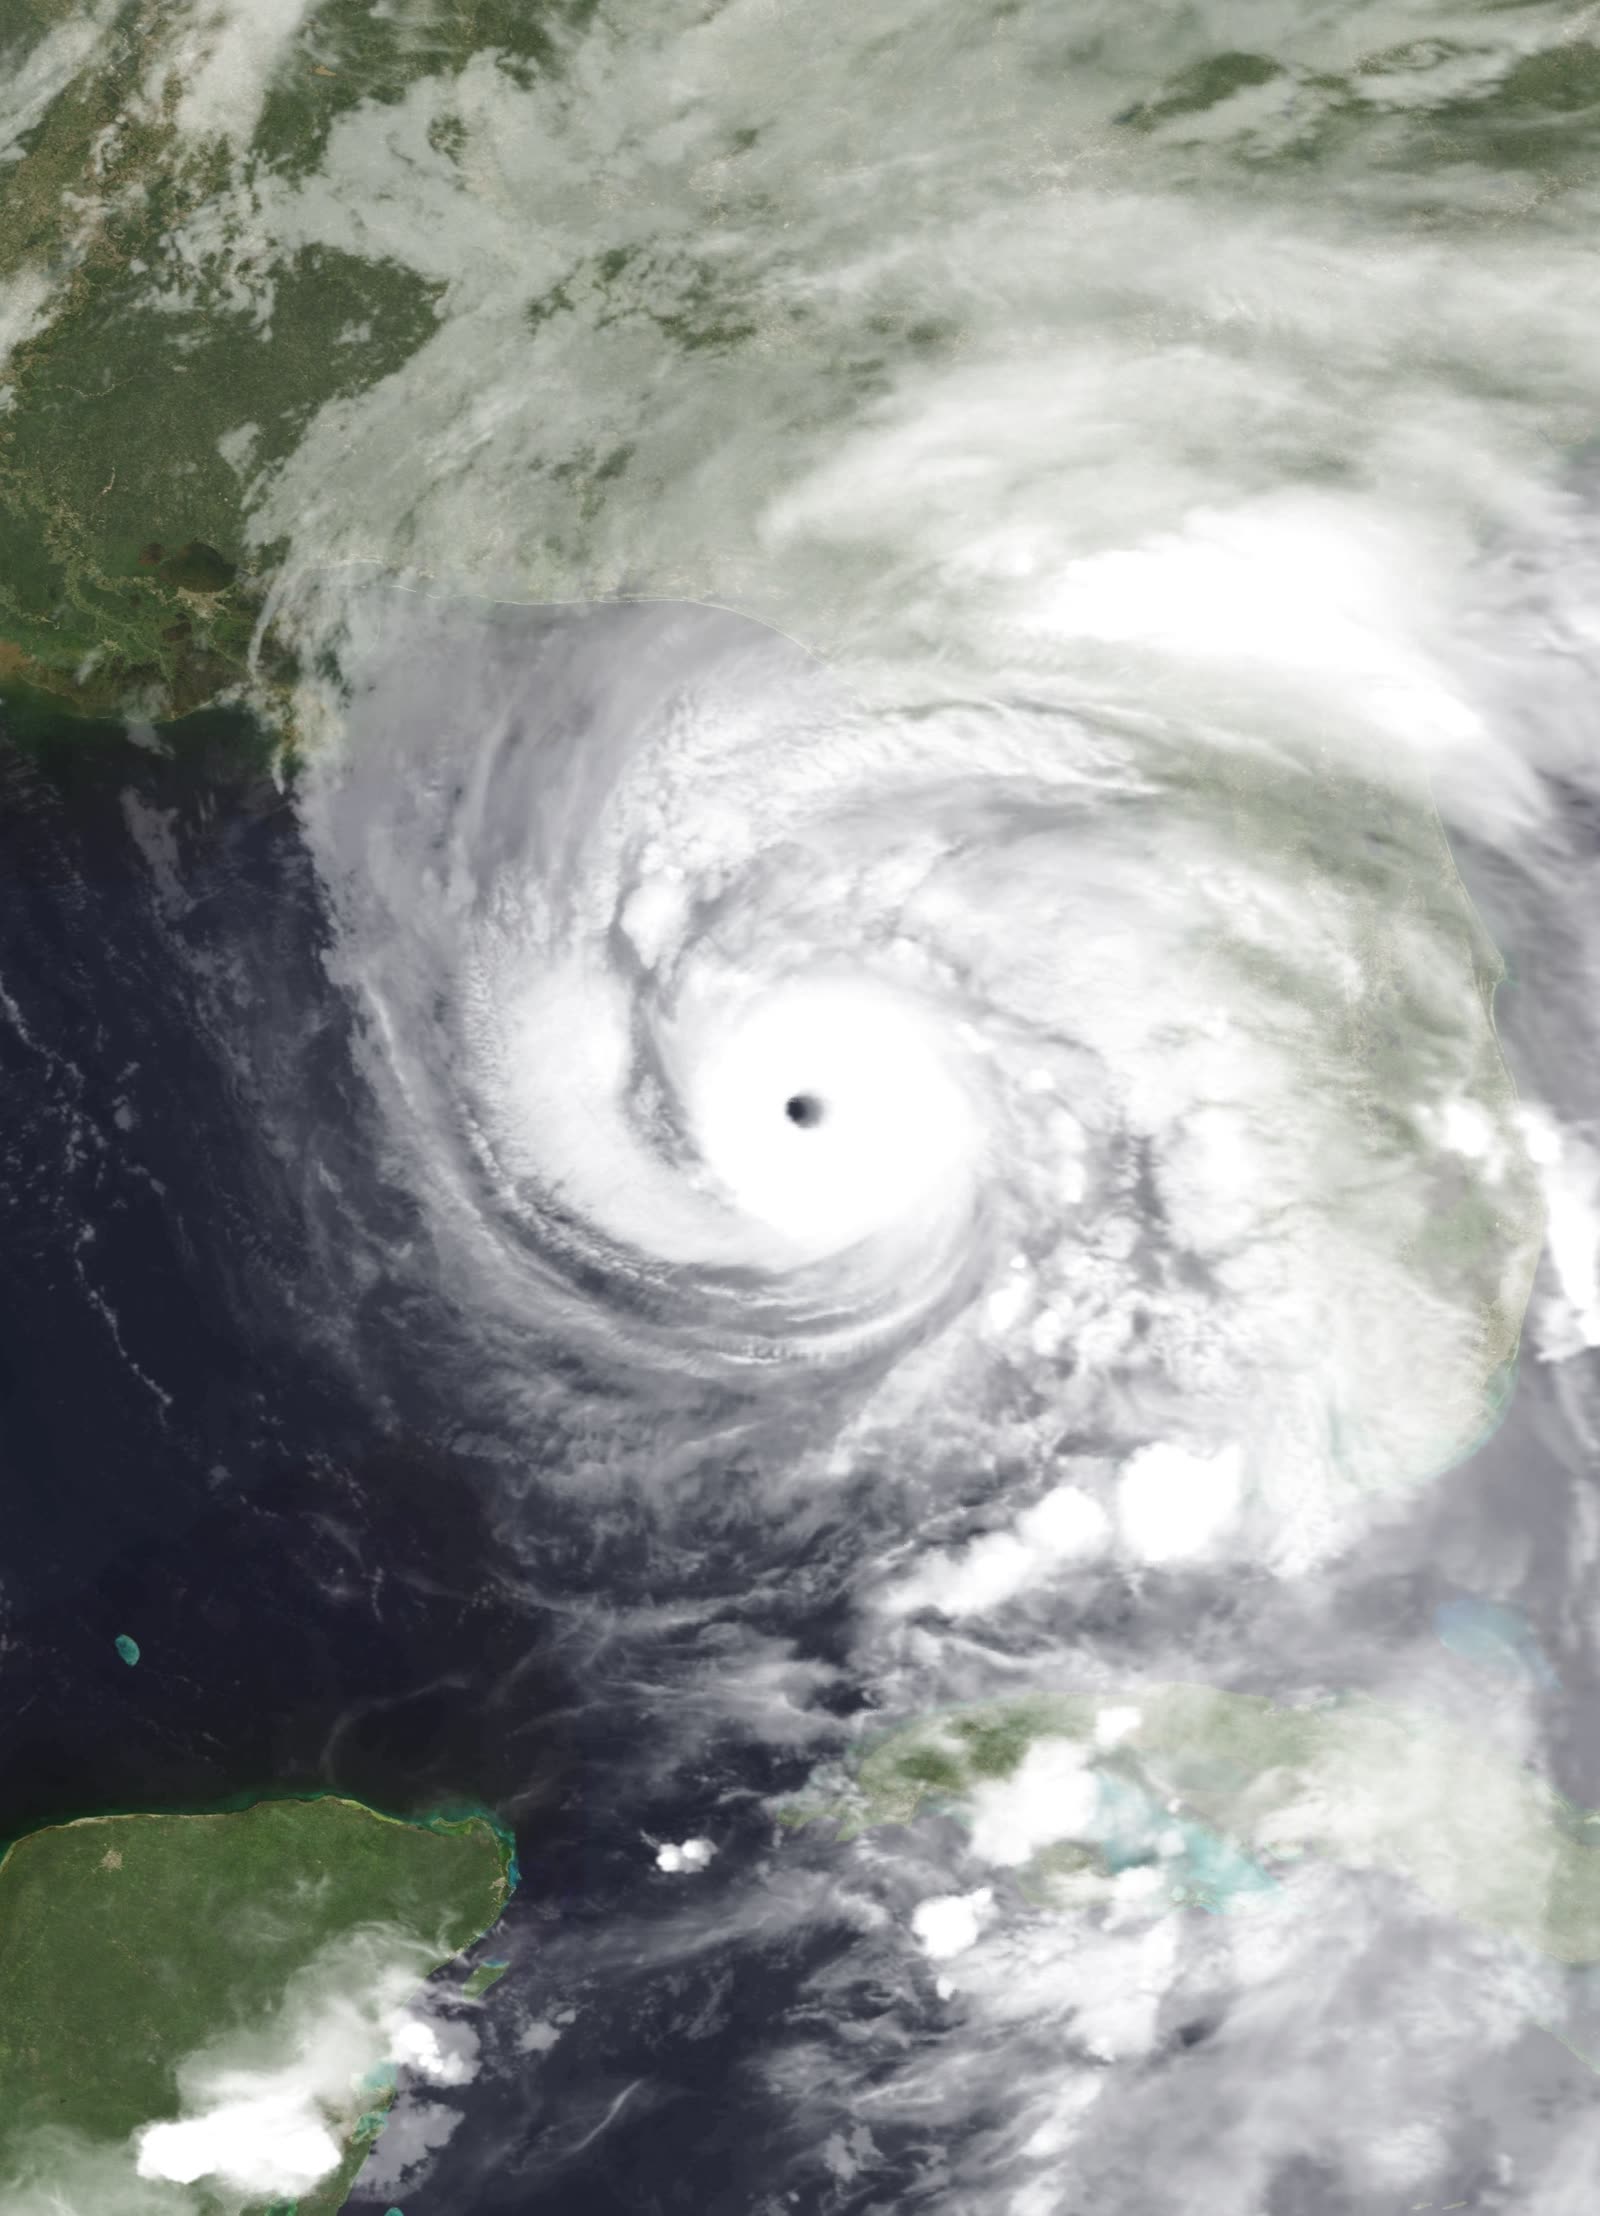
Hurricane Milton
CAT 3 · 180 MPH
Hurricane Milton
2024 · Siesta Key, FL

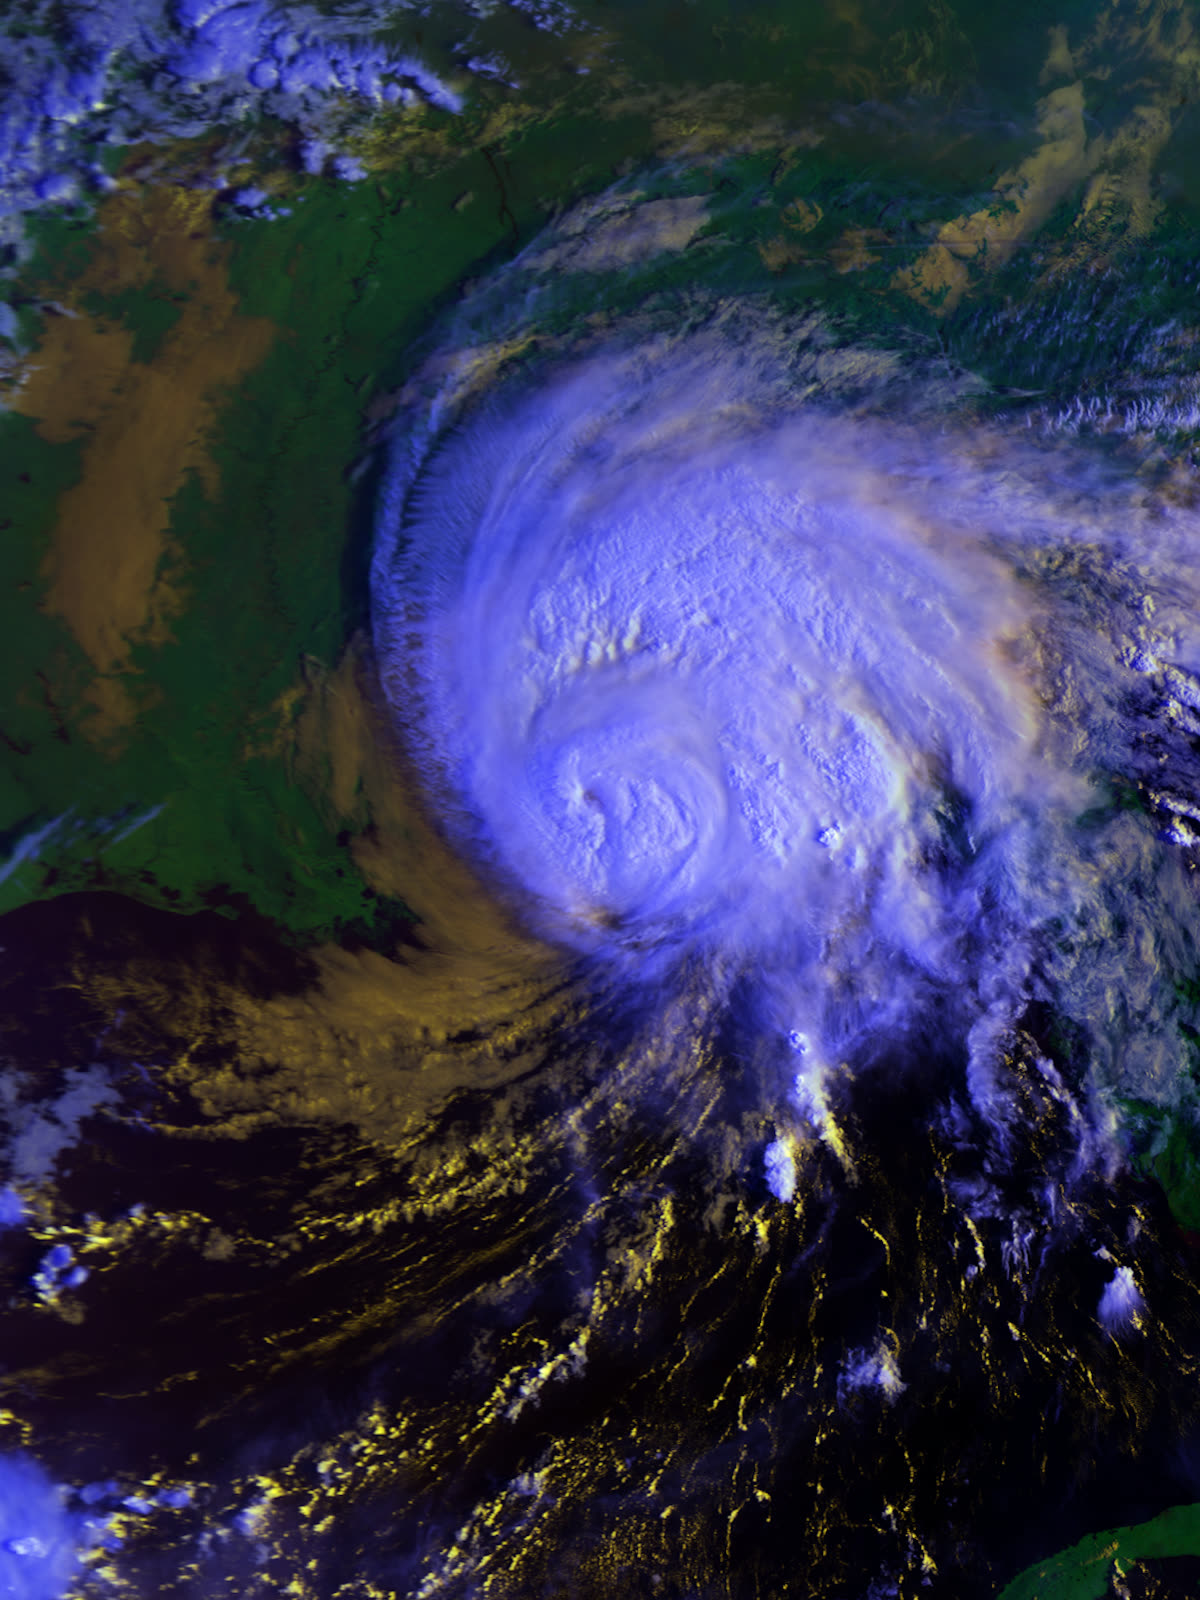
Landed 13 days after Helene — insurers fought over which storm, and which policy, owed for the same house

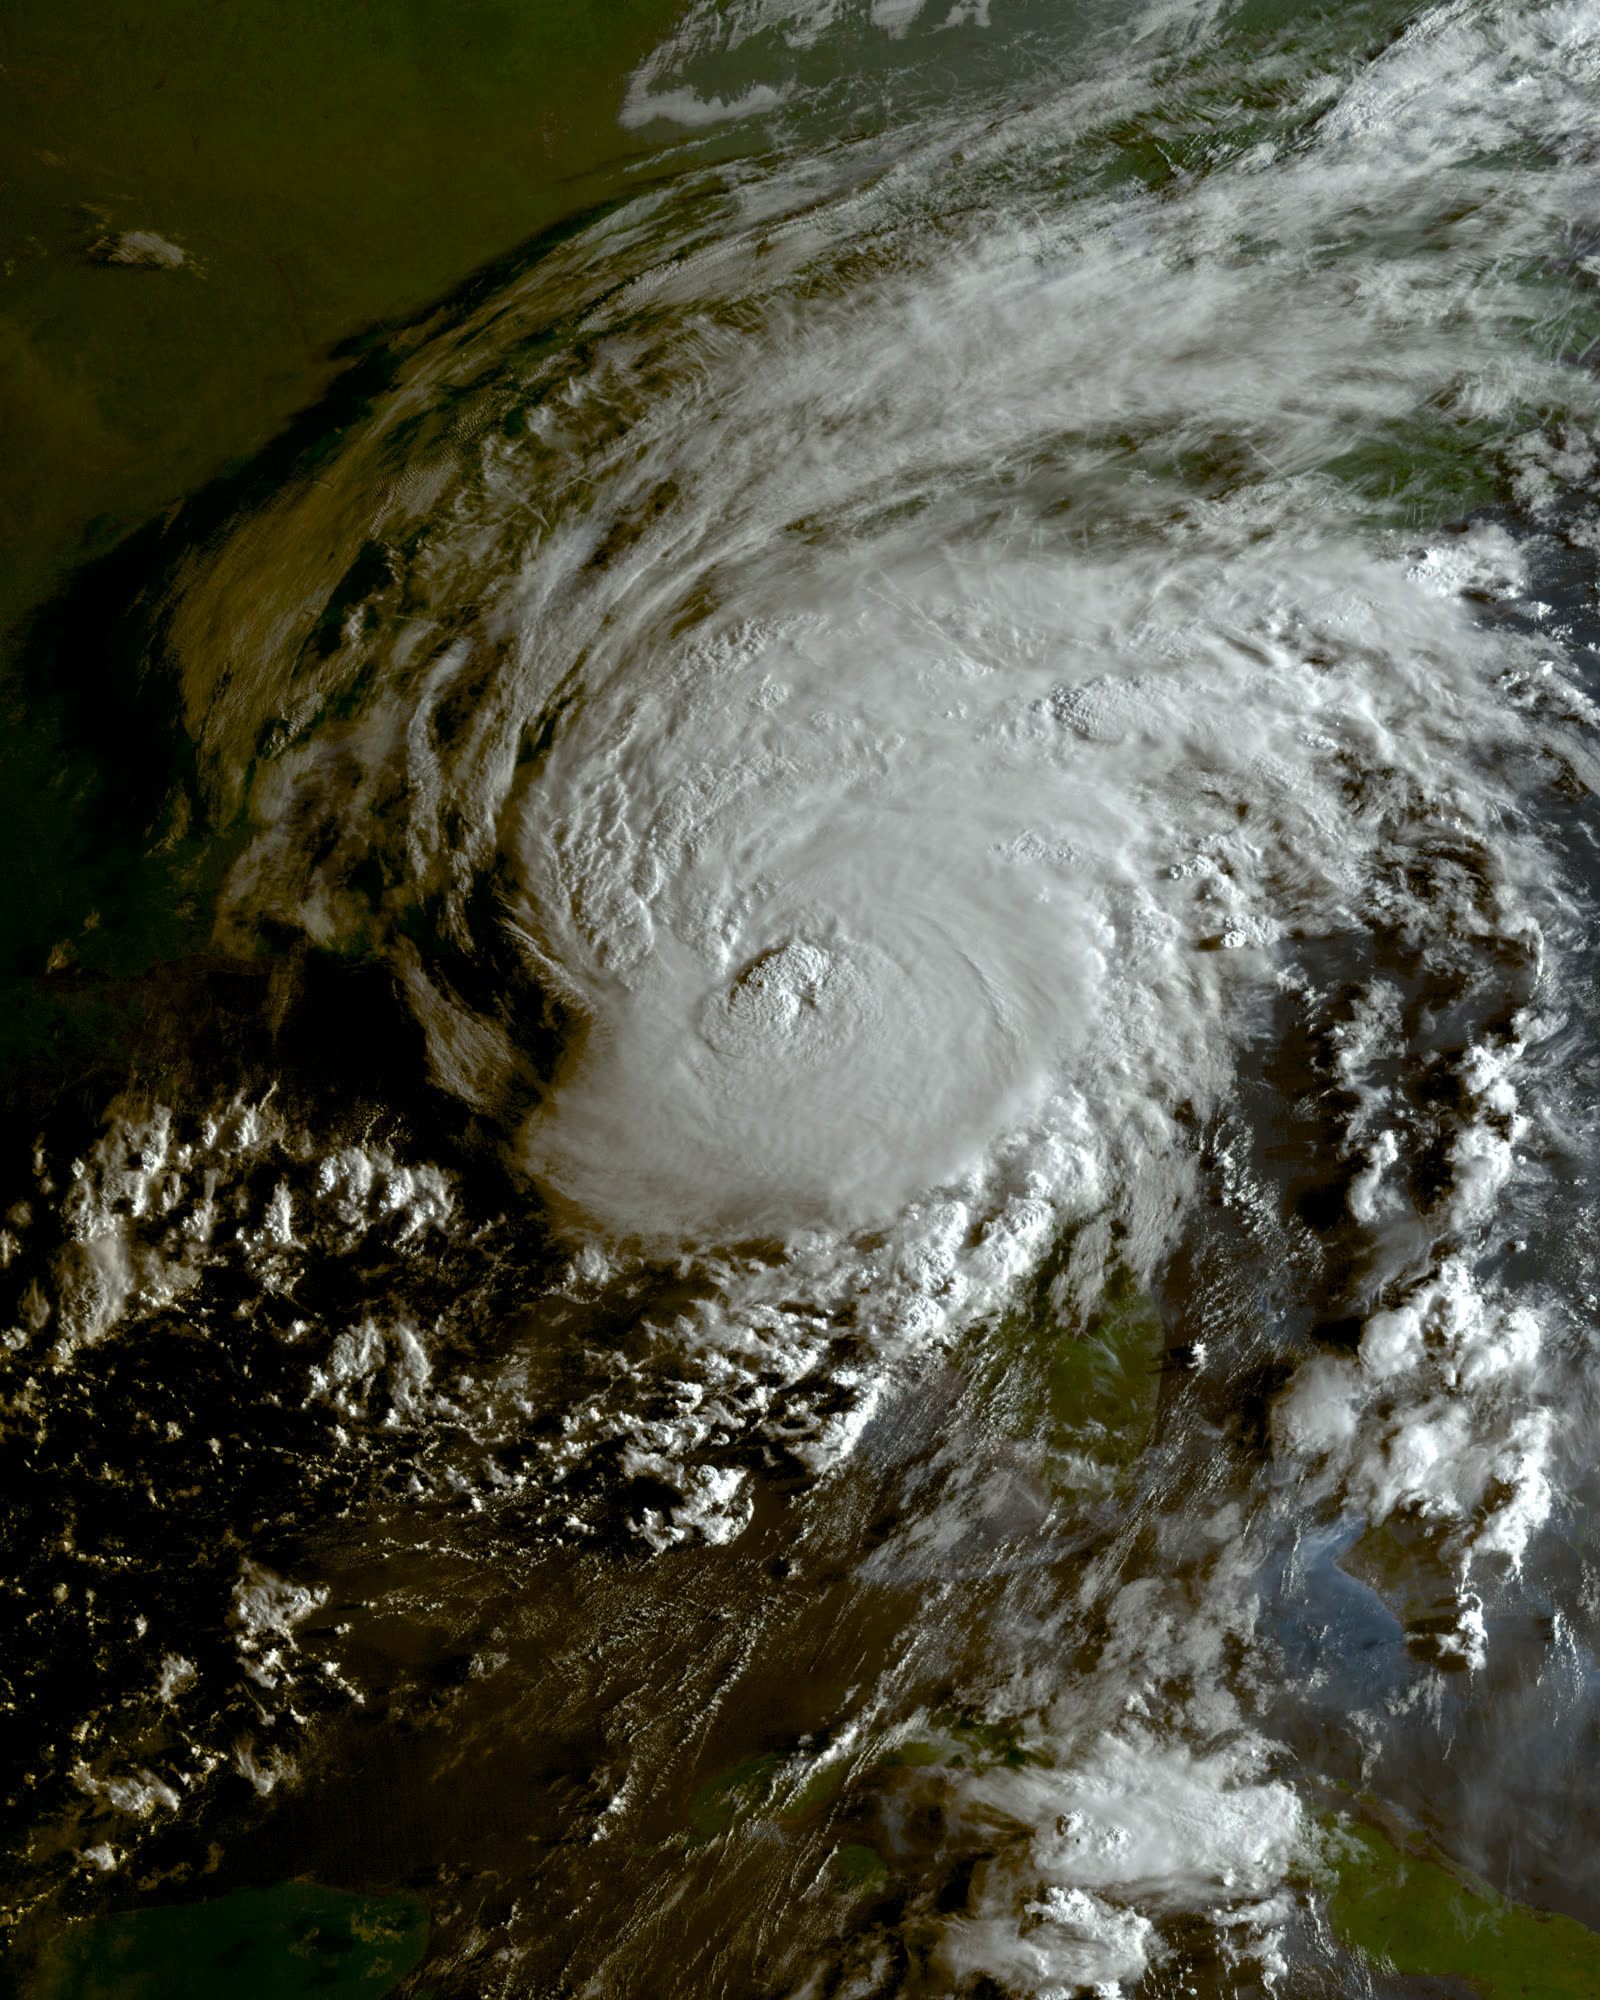
Hurricane Idalia
CAT 3 · 130 MPH 29.8°N 83.6°W
Hurricane Idalia
2023 · Keaton Beach, FL (Big Bend)

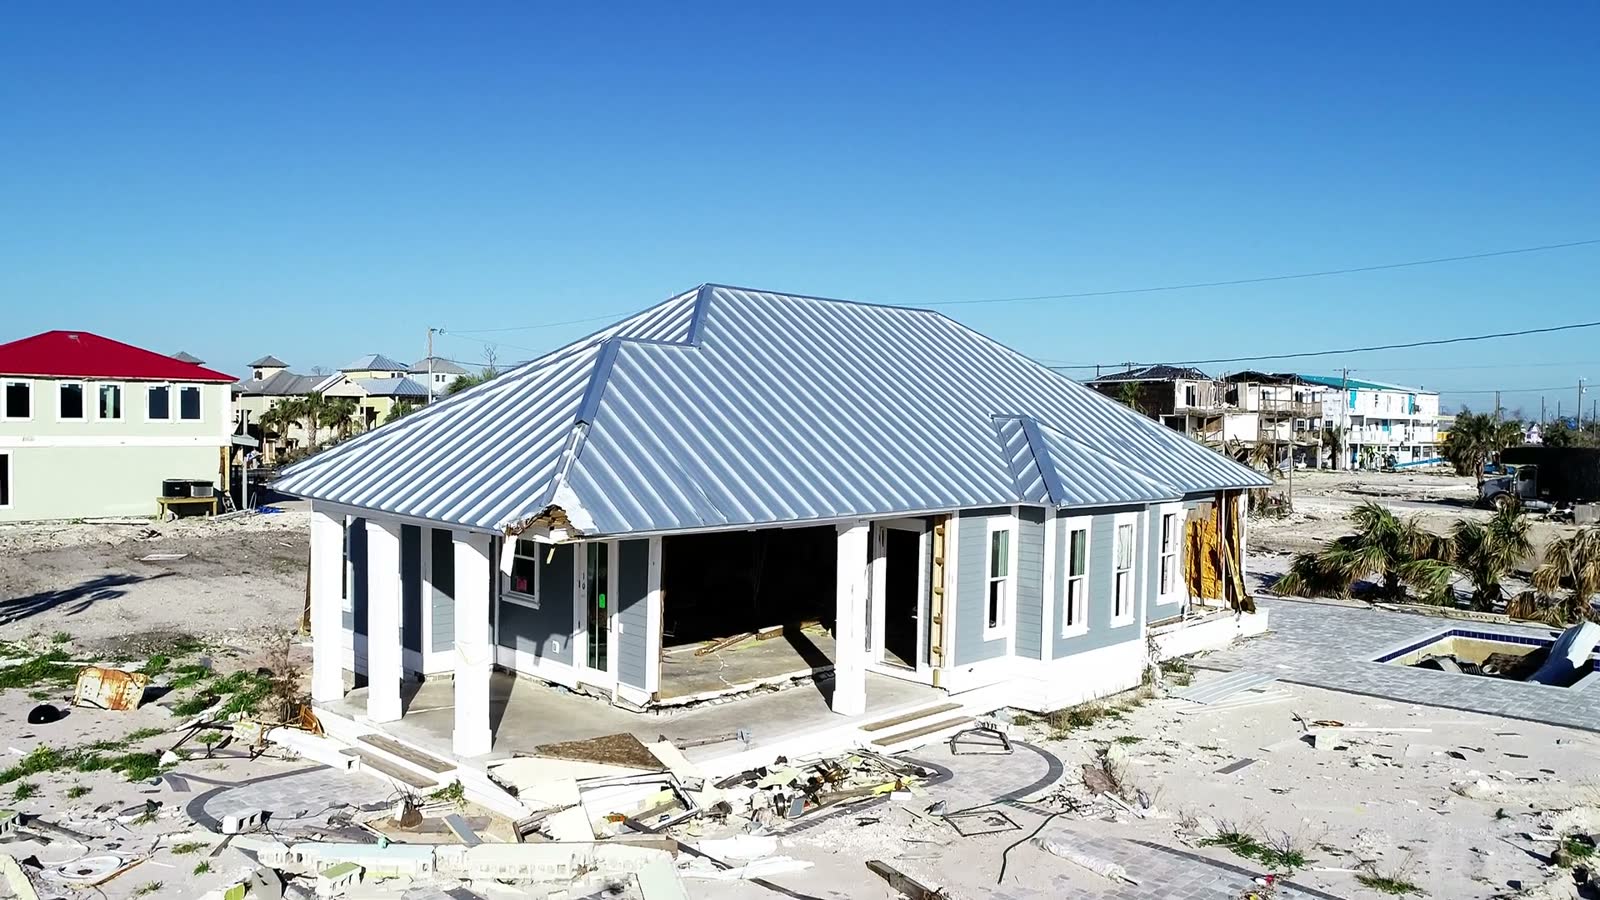
The strongest Big Bend hurricane in over a century produced just $310M in insured losses — because so much of the region carried no insurance at all

Hurricane Ian
CAT 4 · 160 MPH 26.6°N 82.2°W
Hurricane Ian
2022 · Cayo Costa / Fort Myers Beach, FL

Florida's costliest hurricane: 700,000+ claims, roughly 3 in 10 residential claims closed without payment, a surge-vs-wind litigation wave, and the SB 2-A overhaul of Florida claim law.

Hurricane Nicole
CAT 1 · 75 MPH 27.6°N 80.4°W
Hurricane Nicole
2022 · Vero Beach, FL (North Hutchinson Island)

A minimal November hurricane condemned two dozen Daytona-area condo towers — and taught beachfront Florida that erosion isn't a covered peril

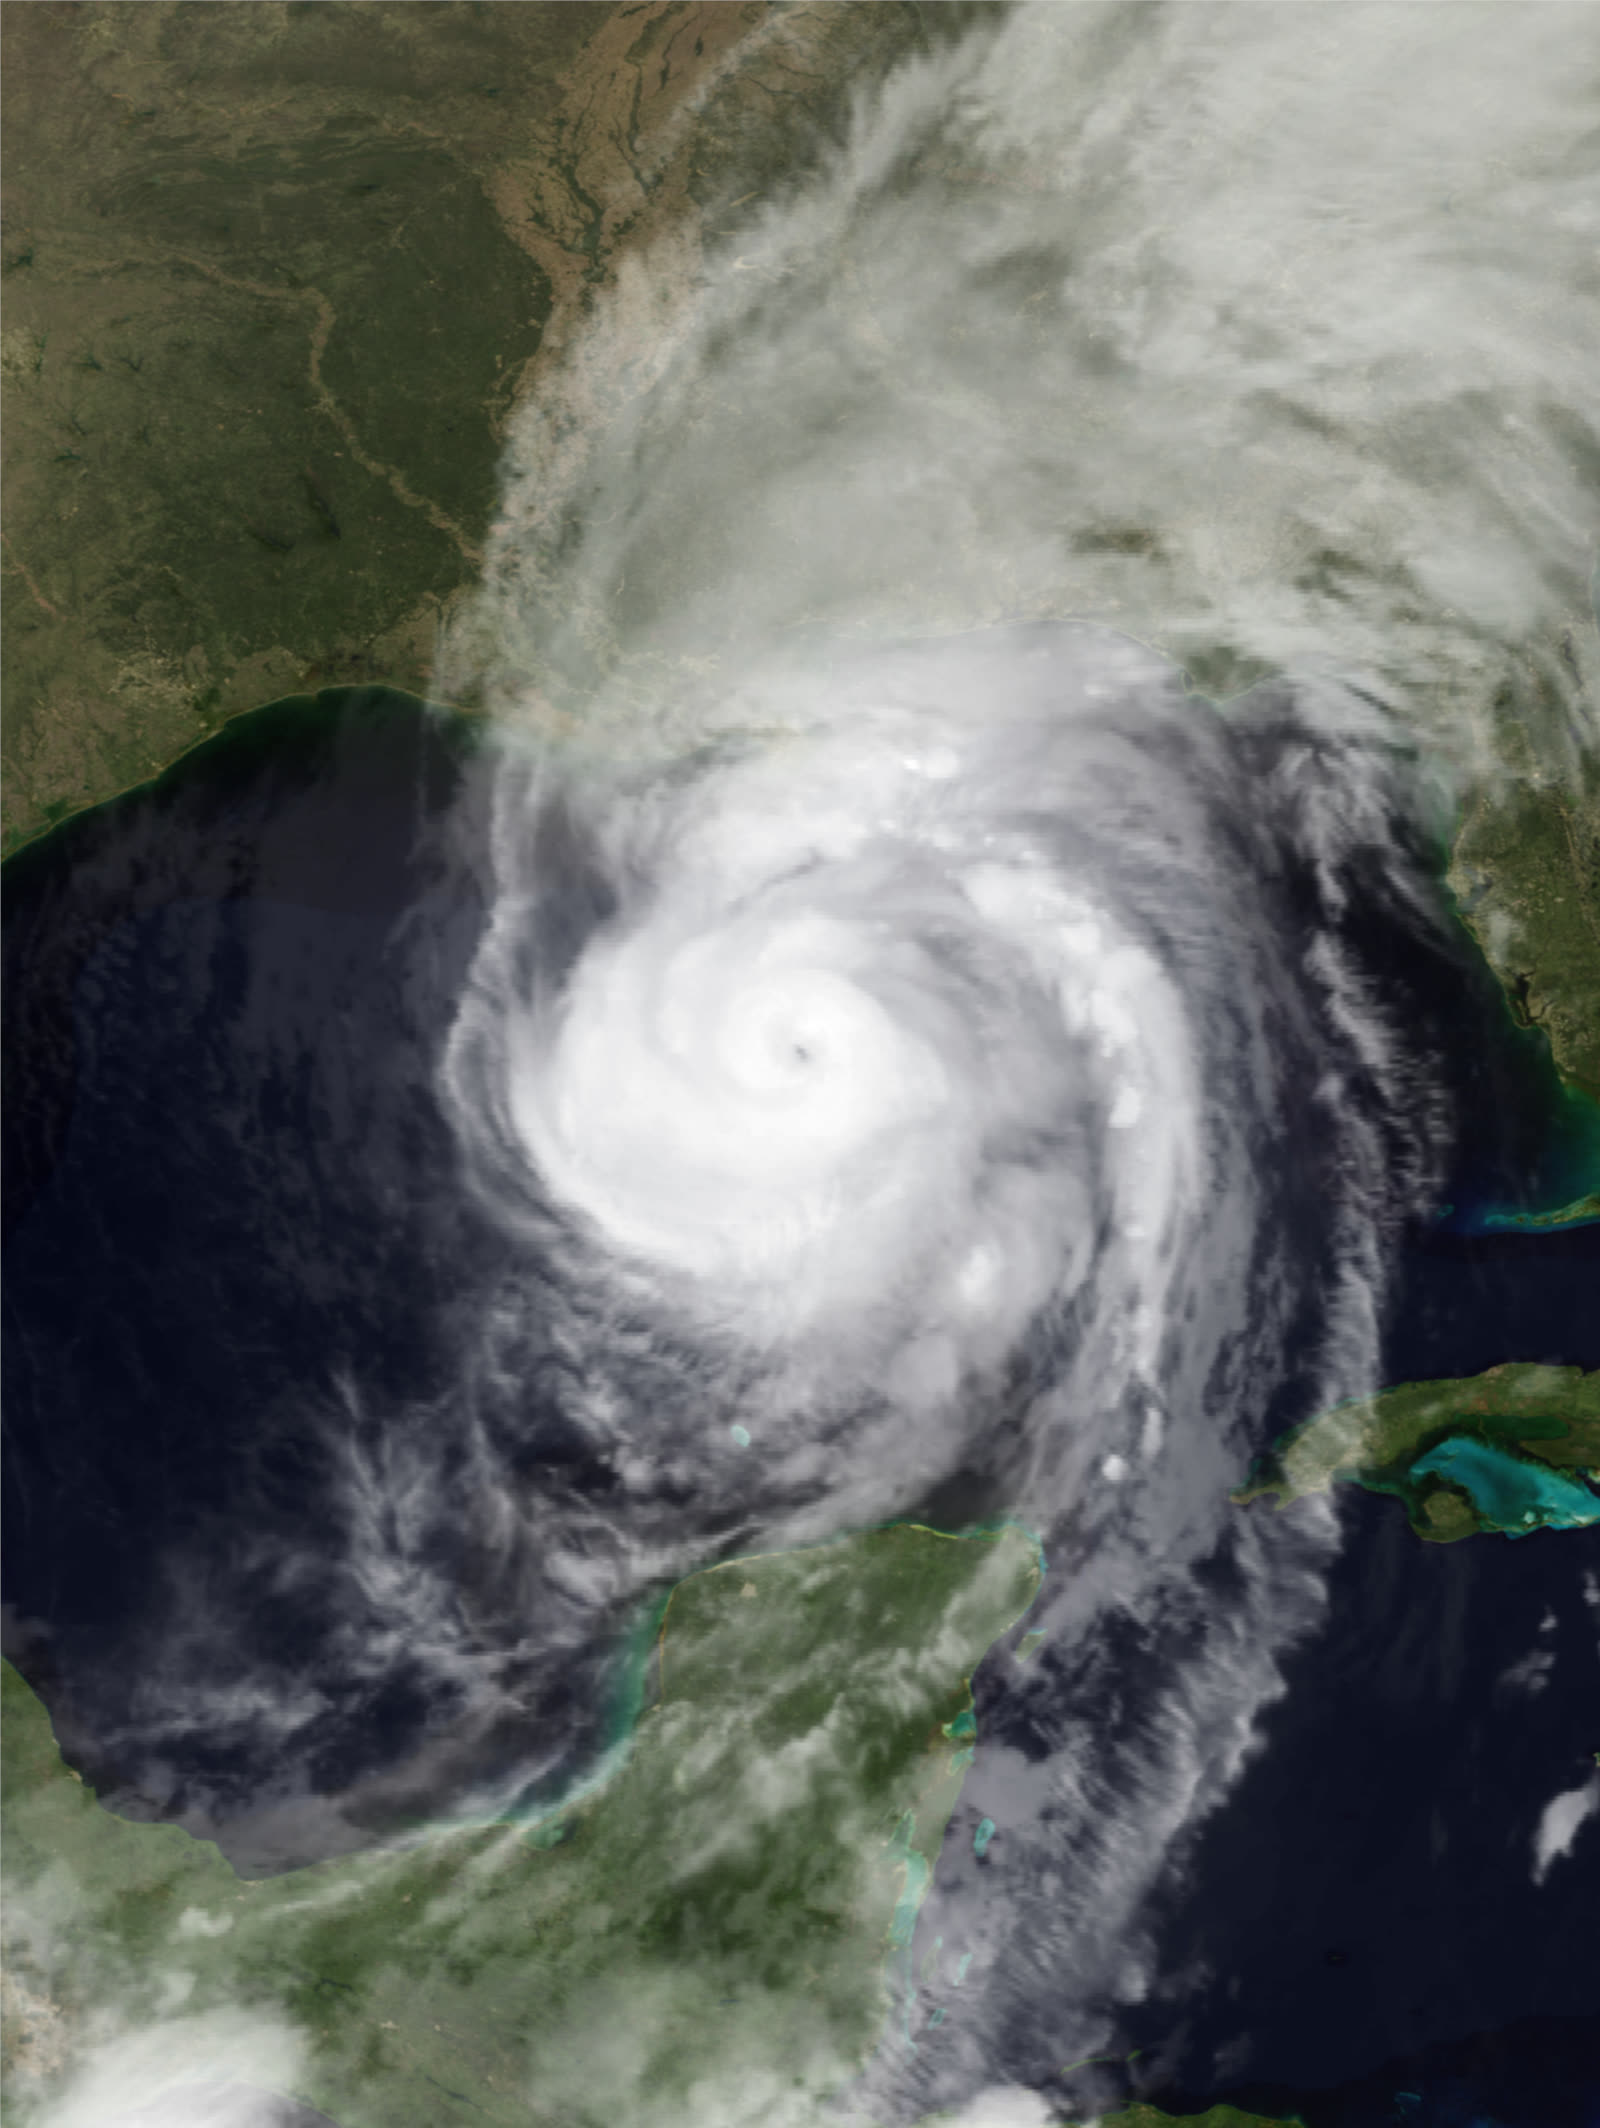
Hurricane Sally
CAT 2 · 110 MPH 30.3°N 87.7°W
Hurricane Sally
2020 · Gulf Shores, AL (flood core over Pensacola, FL)

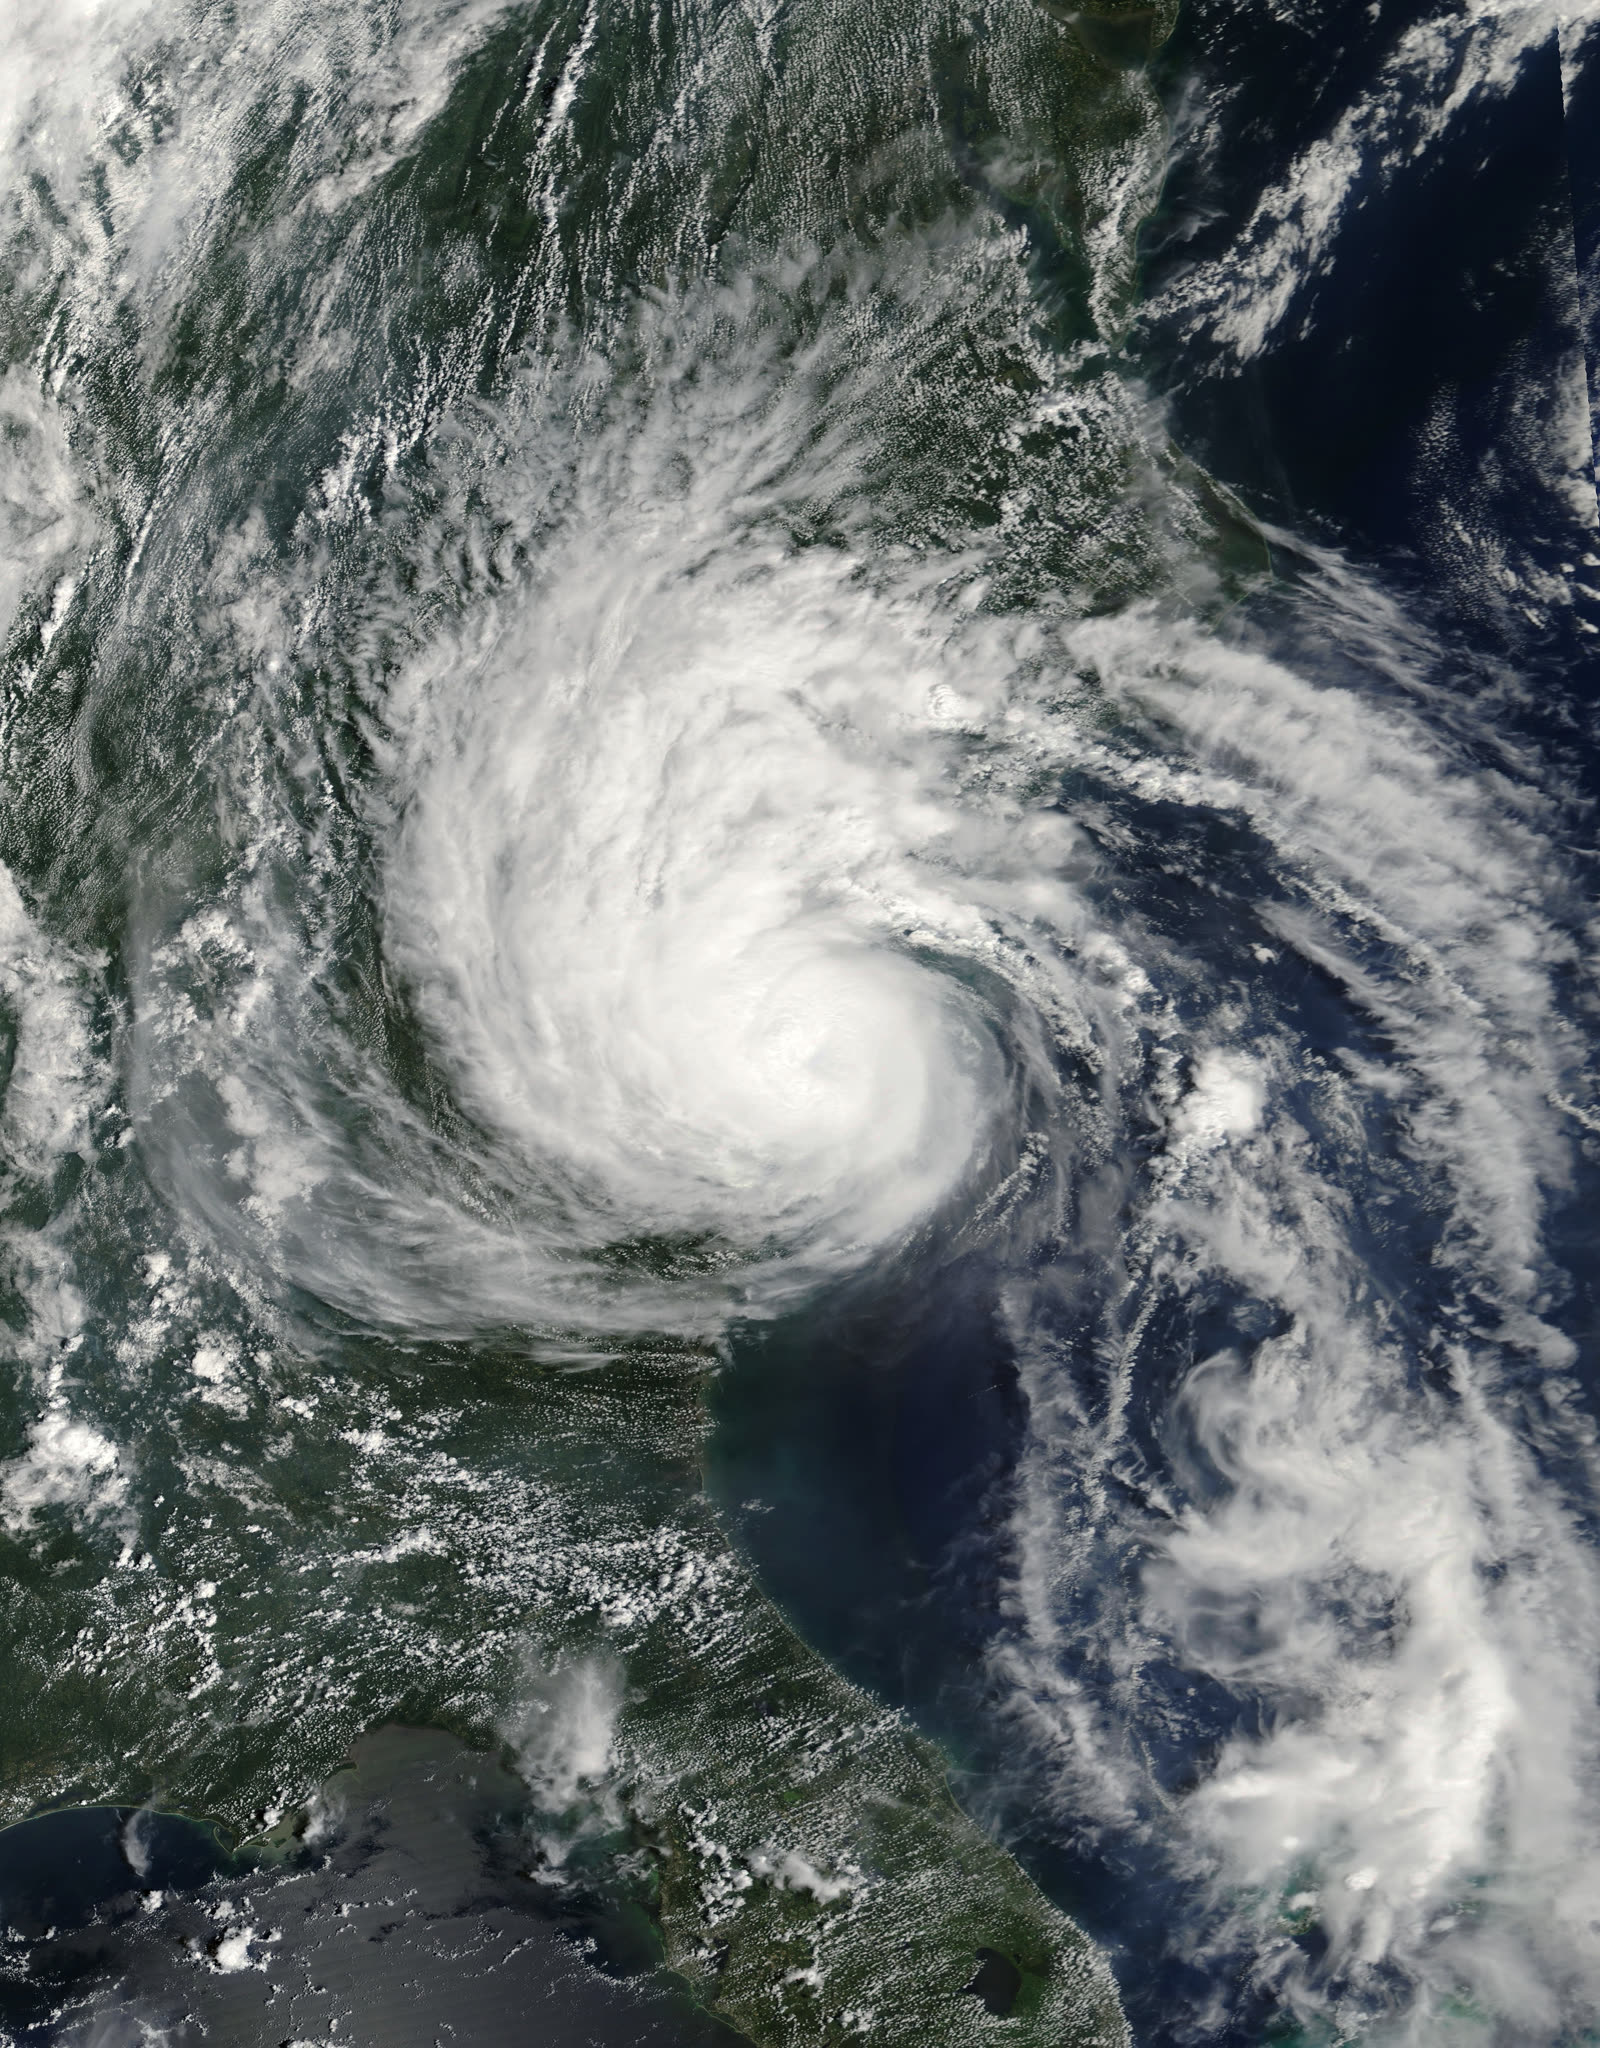
Sally dropped 2 feet of rain on Pensacola — and turned Northwest Florida into a case study in wind-versus-flood claim disputes

Hurricane Michael
CAT 5 · 160 MPH 29.9°N 85.4°W
Hurricane Michael
2018 · Mexico Beach, FL

149,773 claims, $7.4B insured losses — 14% of residential claims still unpaid two years after landfall

Hurricane Irma
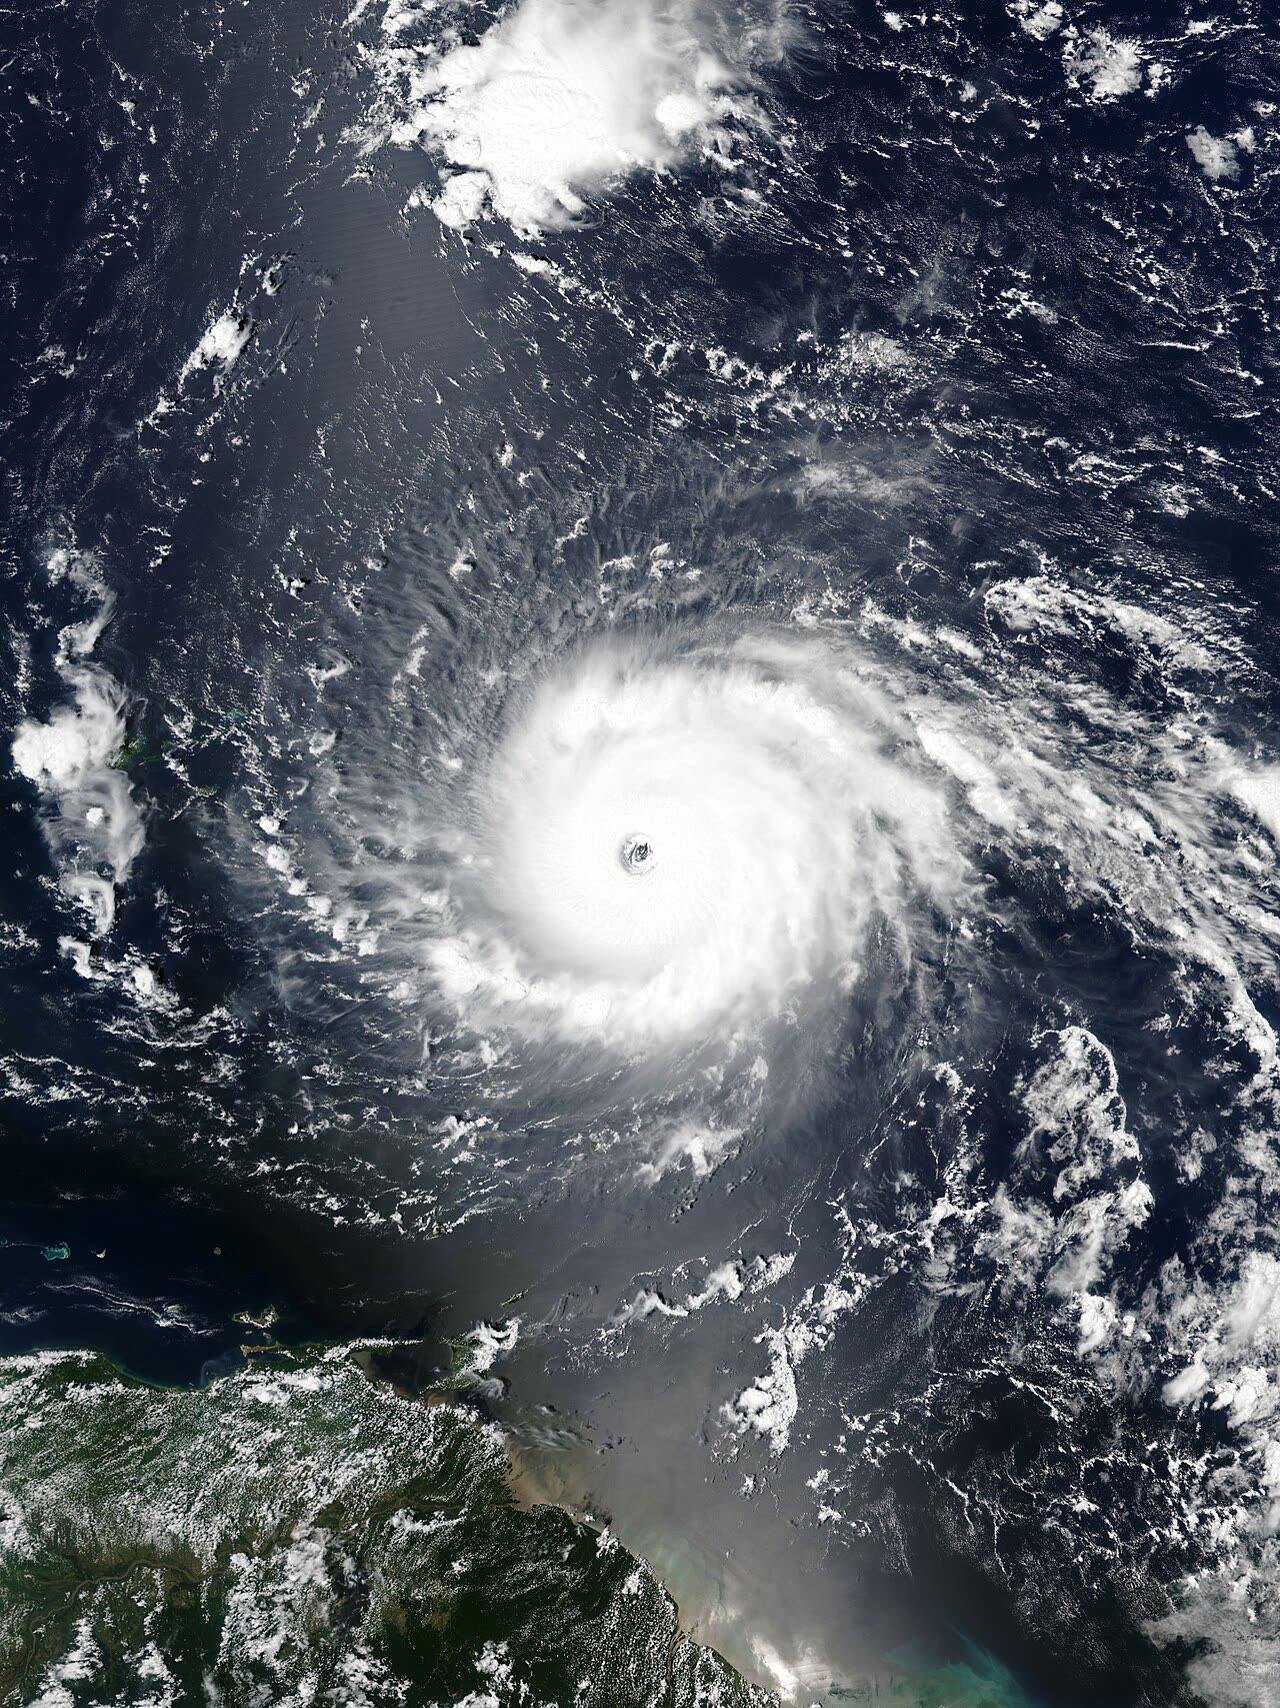
CAT 4 · 180 MPH 24.7°N 81.5°W
Hurricane Irma
2017 · Cudjoe Key, FL

1.1 million Florida claims and $20.7 billion in estimated losses — the storm whose assignment-of-benefits litigation explosion forced the 2019 HB 7065 reforms.

Hurricane Hermine
CAT 1 · 80 MPH 30.1°N 84.2°W
Hurricane Hermine
2016 · St. Marks, FL (eastern Apalachee Bay)

Ended Florida's 11-year hurricane drought — and insurers' first estimates put nearly a third of the loss in coastal flooding most homeowners policies excluded

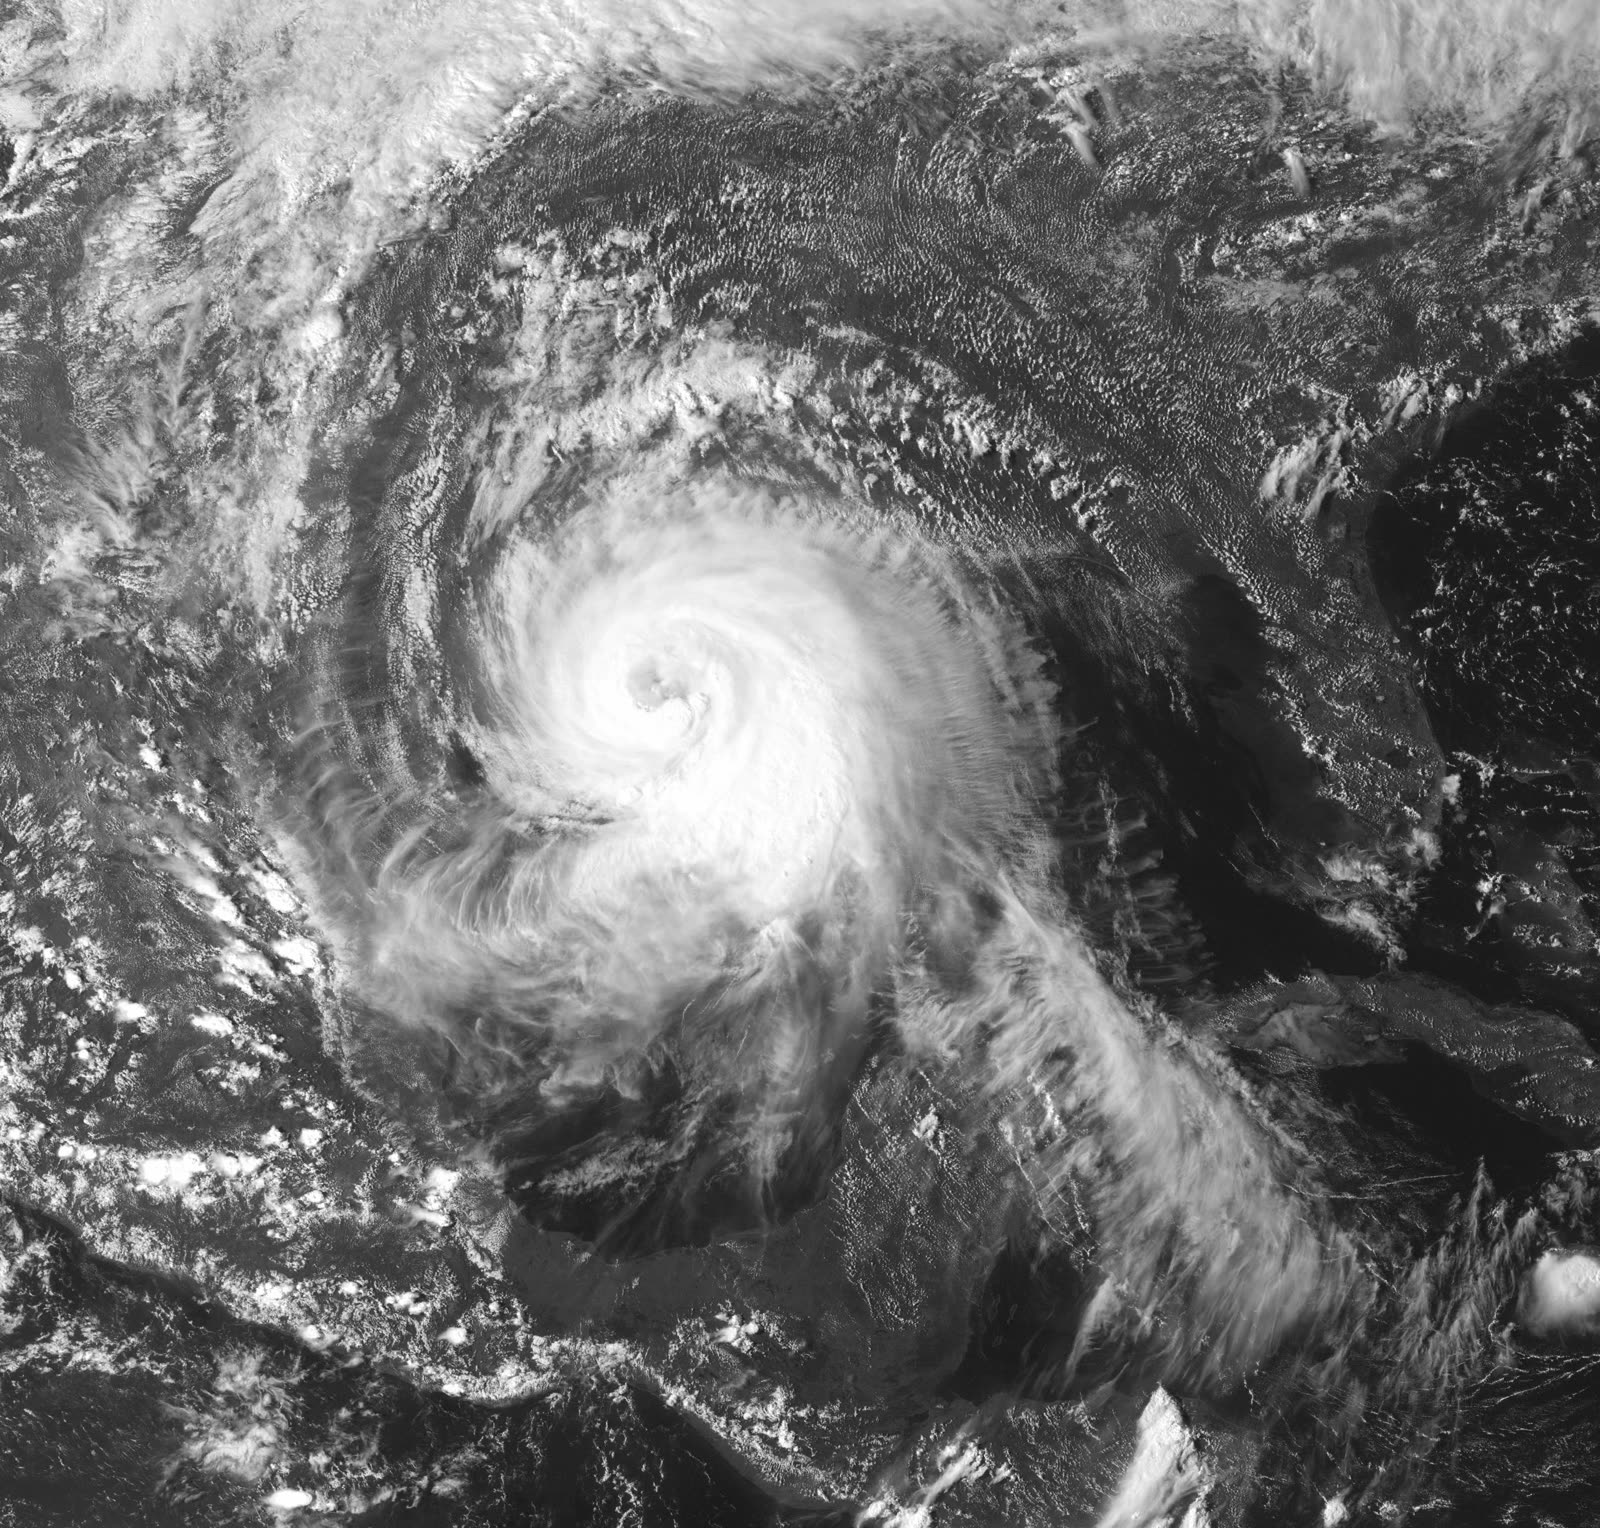
Hurricane Matthew
CAT 1 · 165 MPH 33.0°N 79.6°W
Hurricane Matthew
2016 · McClellanville, SC — after paralleling the entire FL east coast offshore

Matthew never made a Florida landfall — and still generated 100,000+ Florida claims, proving a near-miss can be a full-scale insurance event

Hurricane Dennis
CAT 3 · 150 MPH 30.4°N 87.1°W
Hurricane Dennis
2005 · Santa Rosa Island, FL (between Navarre Beach and Gulf Breeze)

Hit a Panhandle still under Ivan's blue tarps ten months later — mid-repair homes turned into prior-damage denial fights

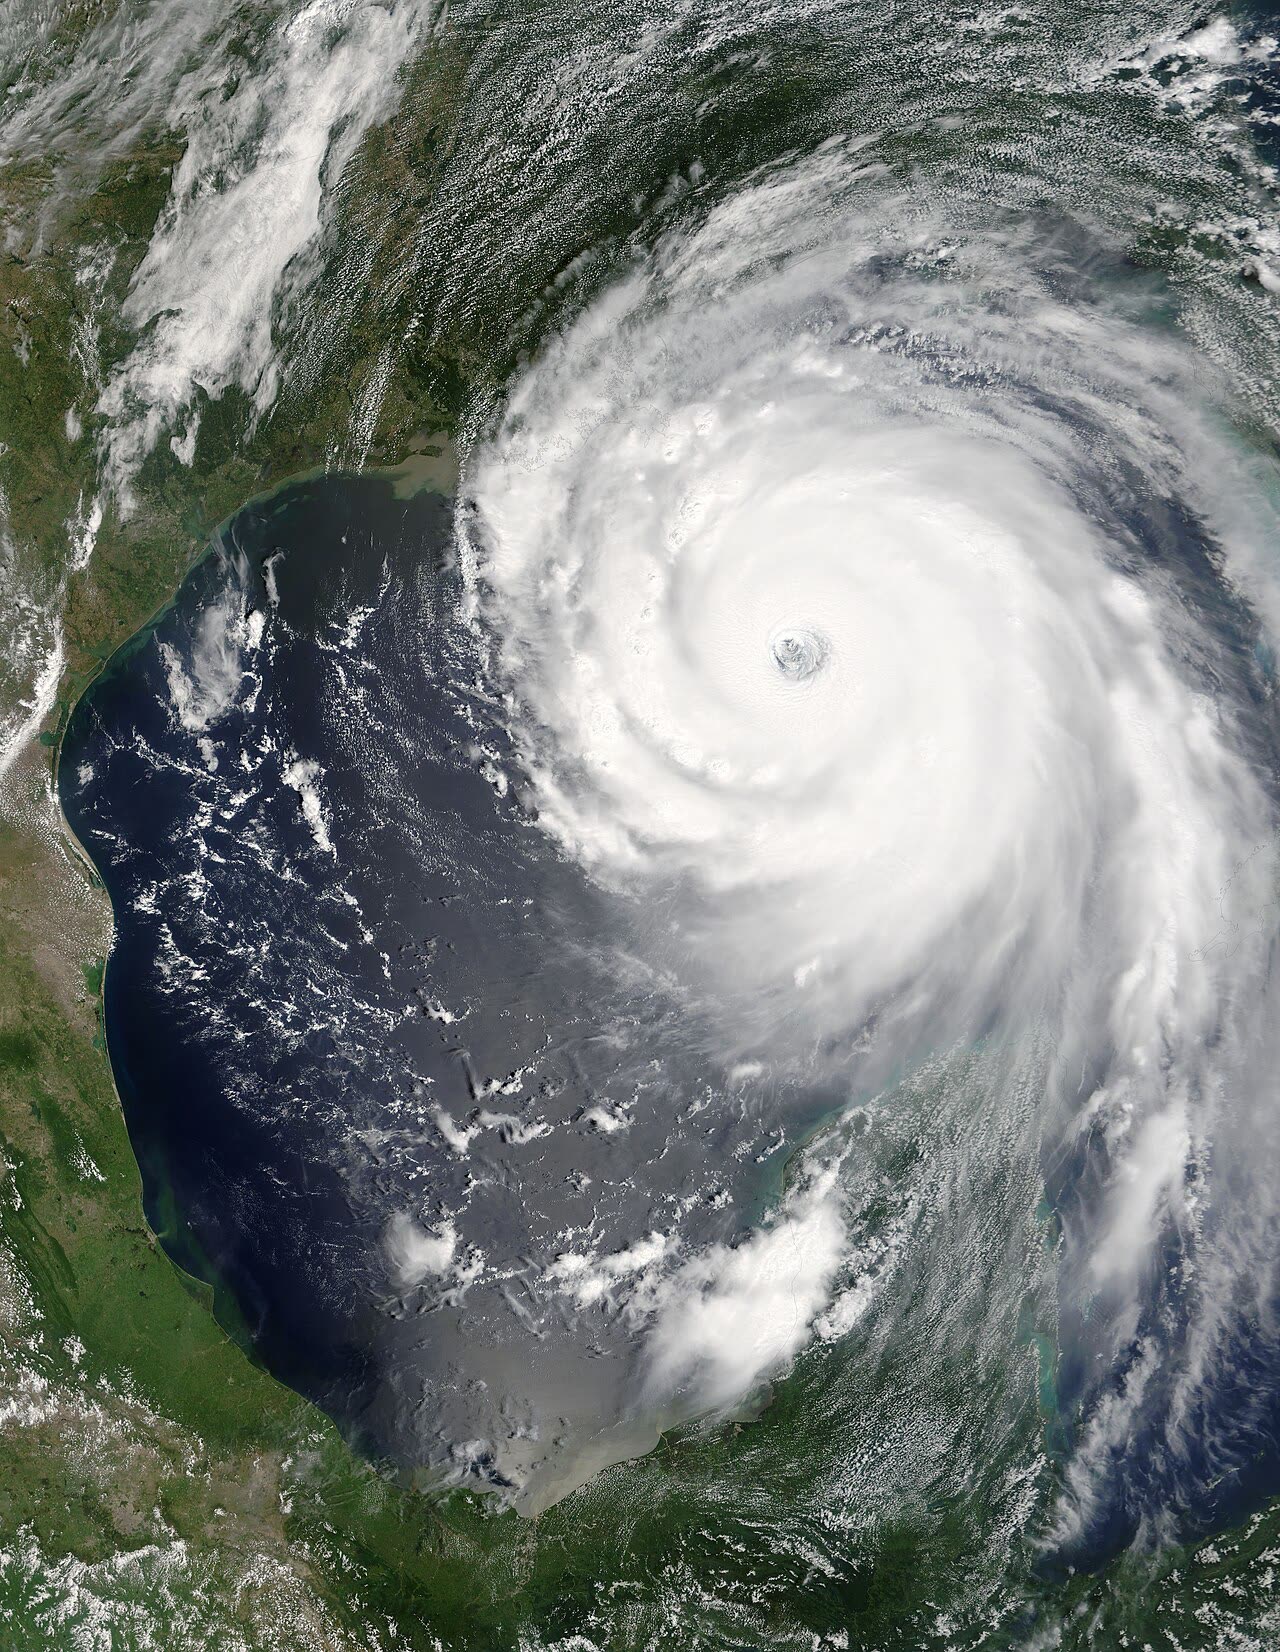
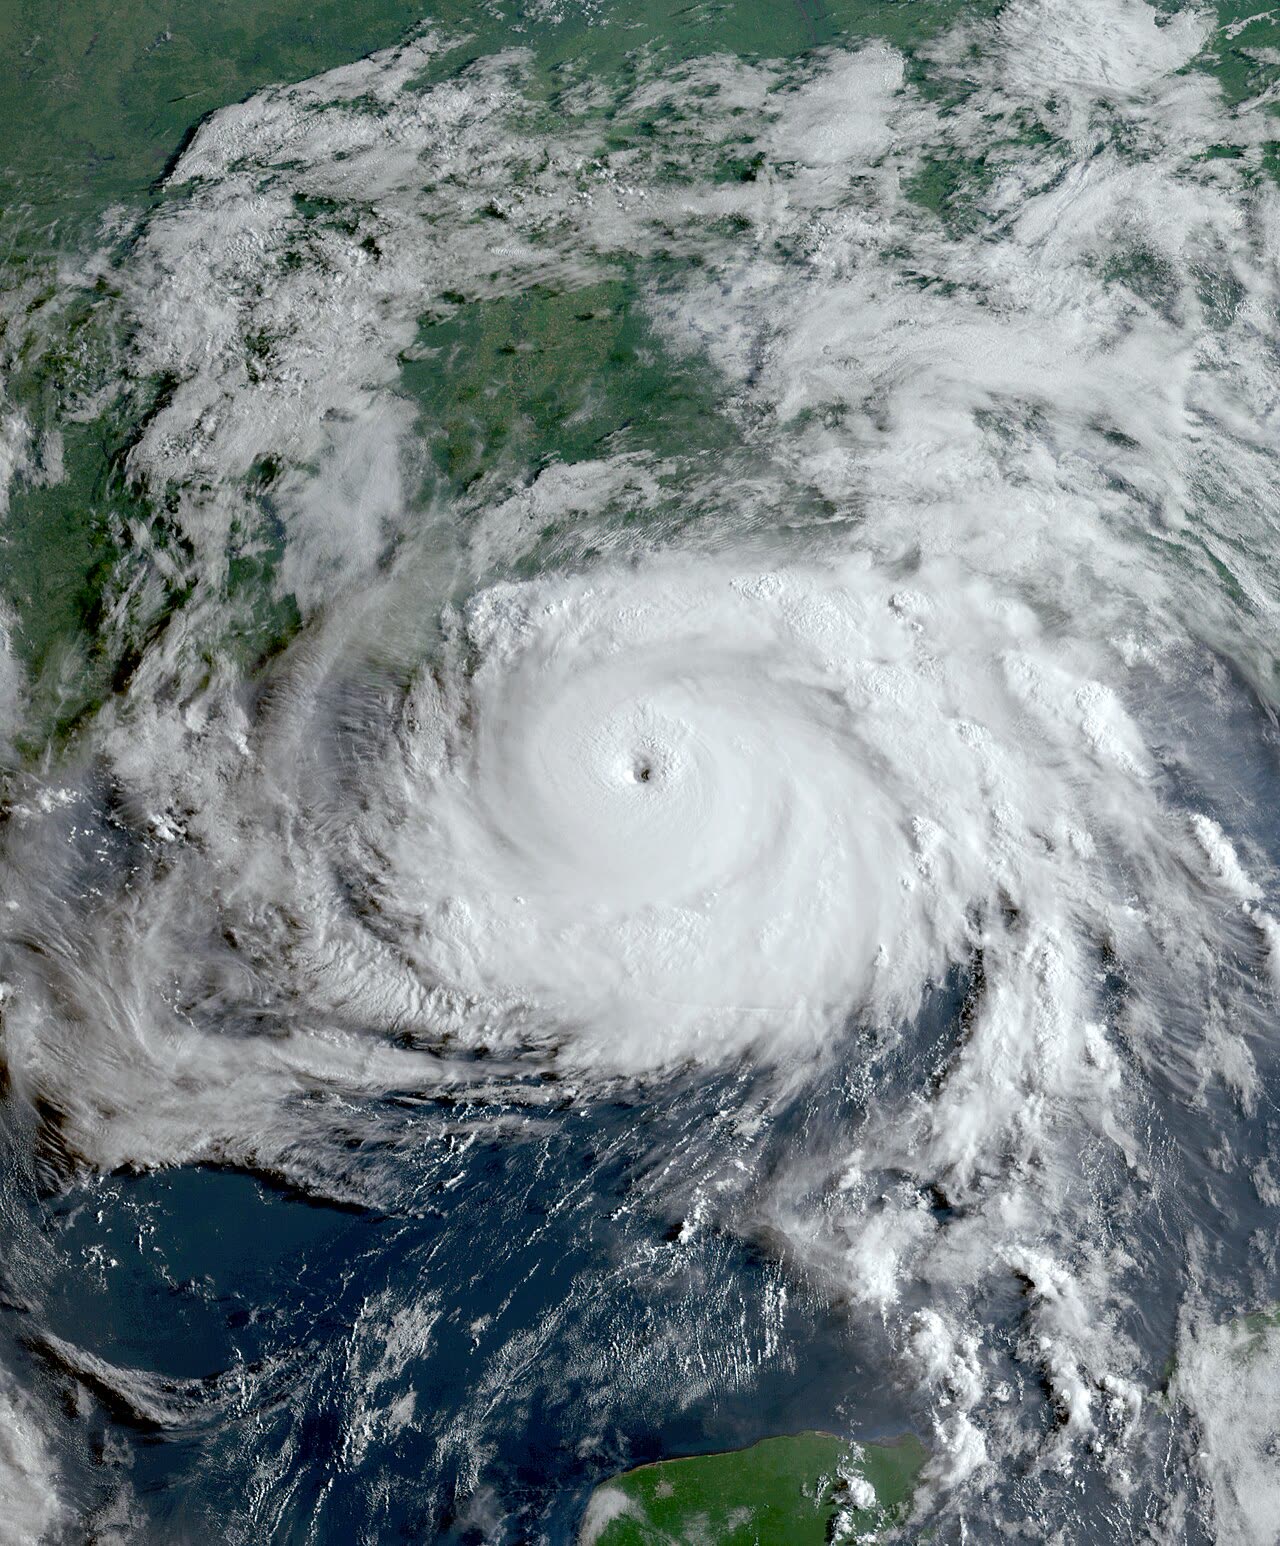
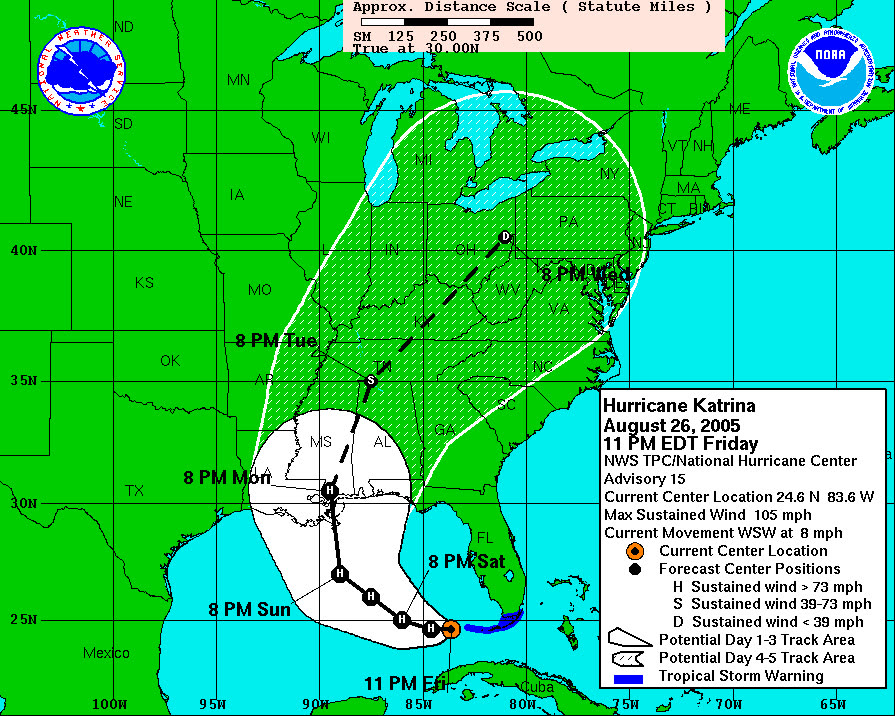
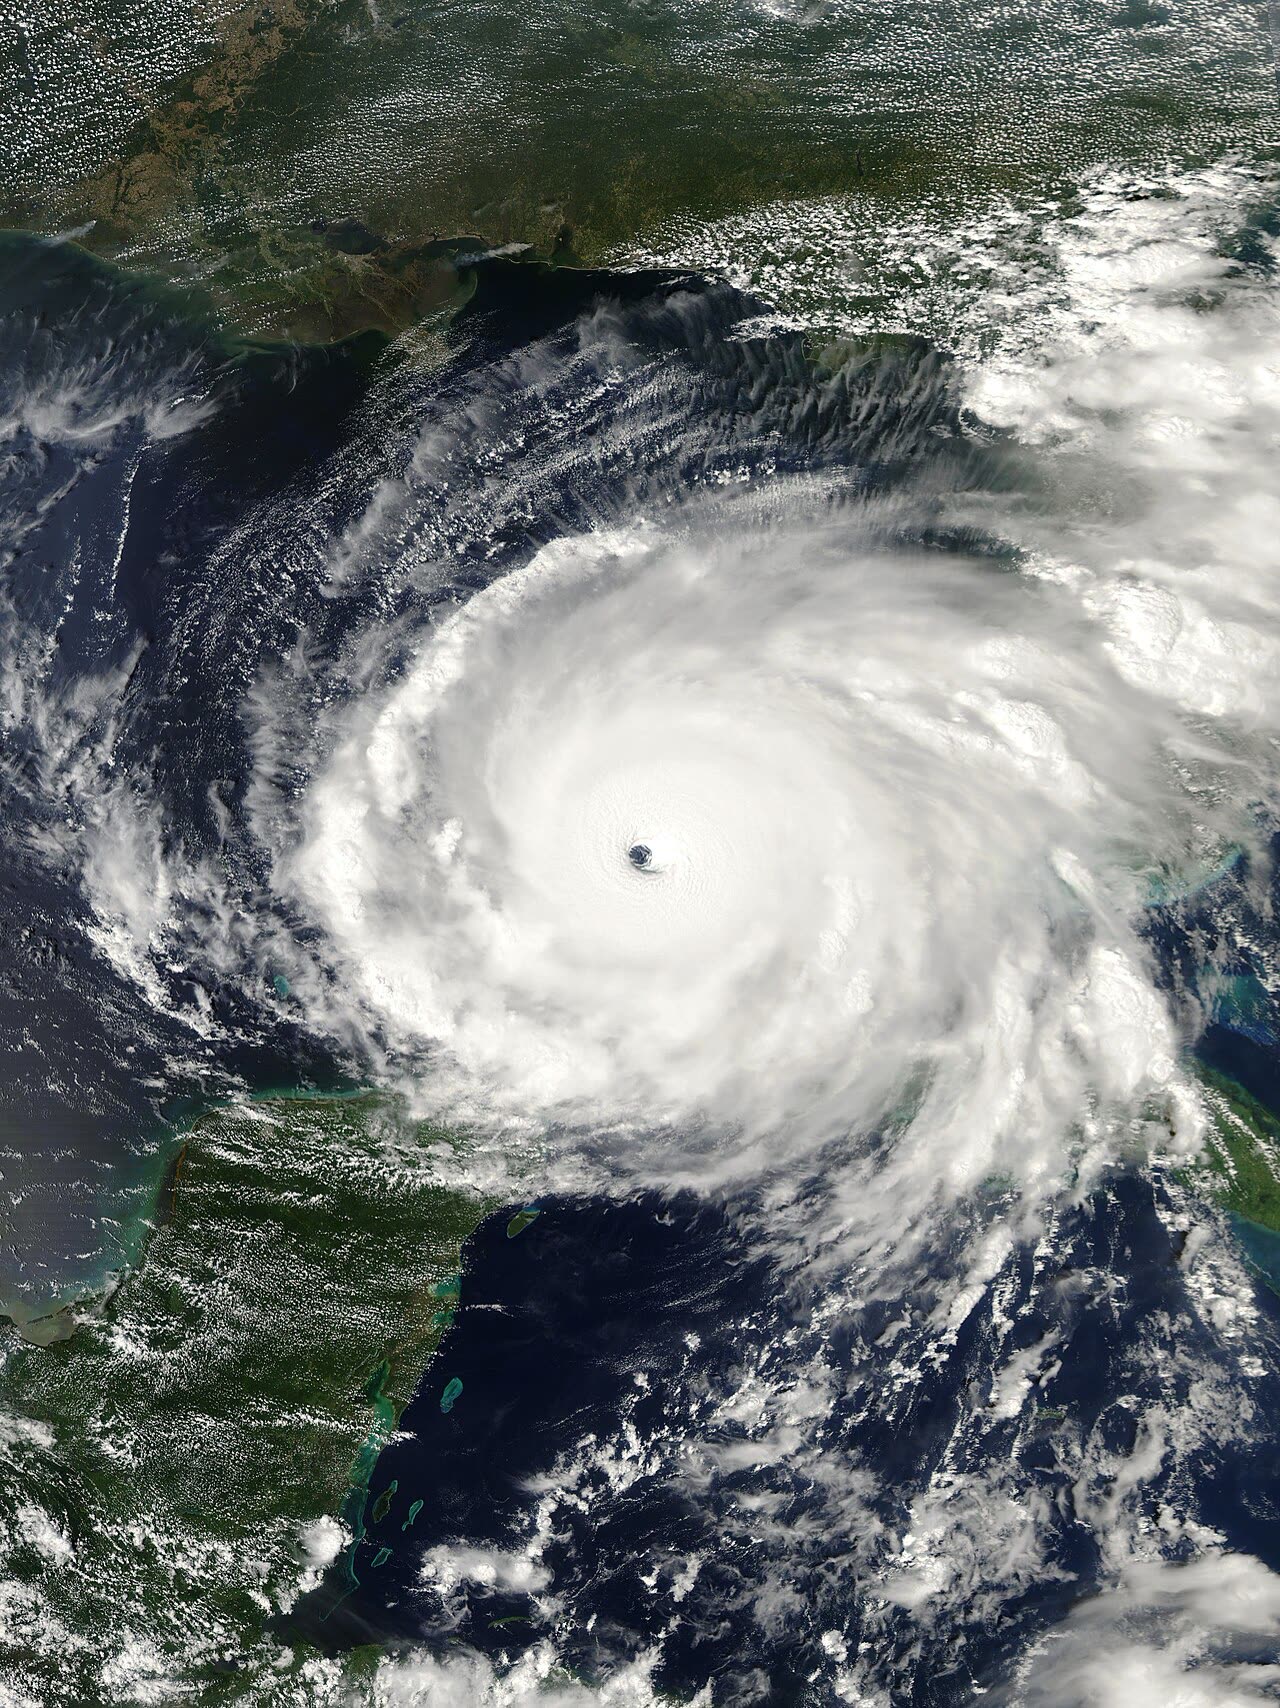
Hurricane Katrina
CAT 3 · 175 MPH
Hurricane Katrina
2005 · Buras, LA

Largest NFIP payout in history ($16.3B) — and the wind-vs-water litigation that still defines hurricane claim denials

Hurricane Wilma
CAT 3 · 185 MPH 25.9°N 81.7°W
Hurricane Wilma
2005 · Cape Romano, FL

Over 1 million Florida claims, still being paid five years later — the reopened-claim wave that produced Florida's 3-year hurricane claim deadline

Hurricane Charley
CAT 4 · 150 MPH 26.6°N 82.2°W
Hurricane Charley
2004 · Cayo Costa / Punta Gorda, FL

A court ruling weeks before landfall — Mierzwa — put full policy limits on the table for mixed-peril total losses; the 2005 Legislature rewrote the Valued Policy Law in response

Hurricane Frances
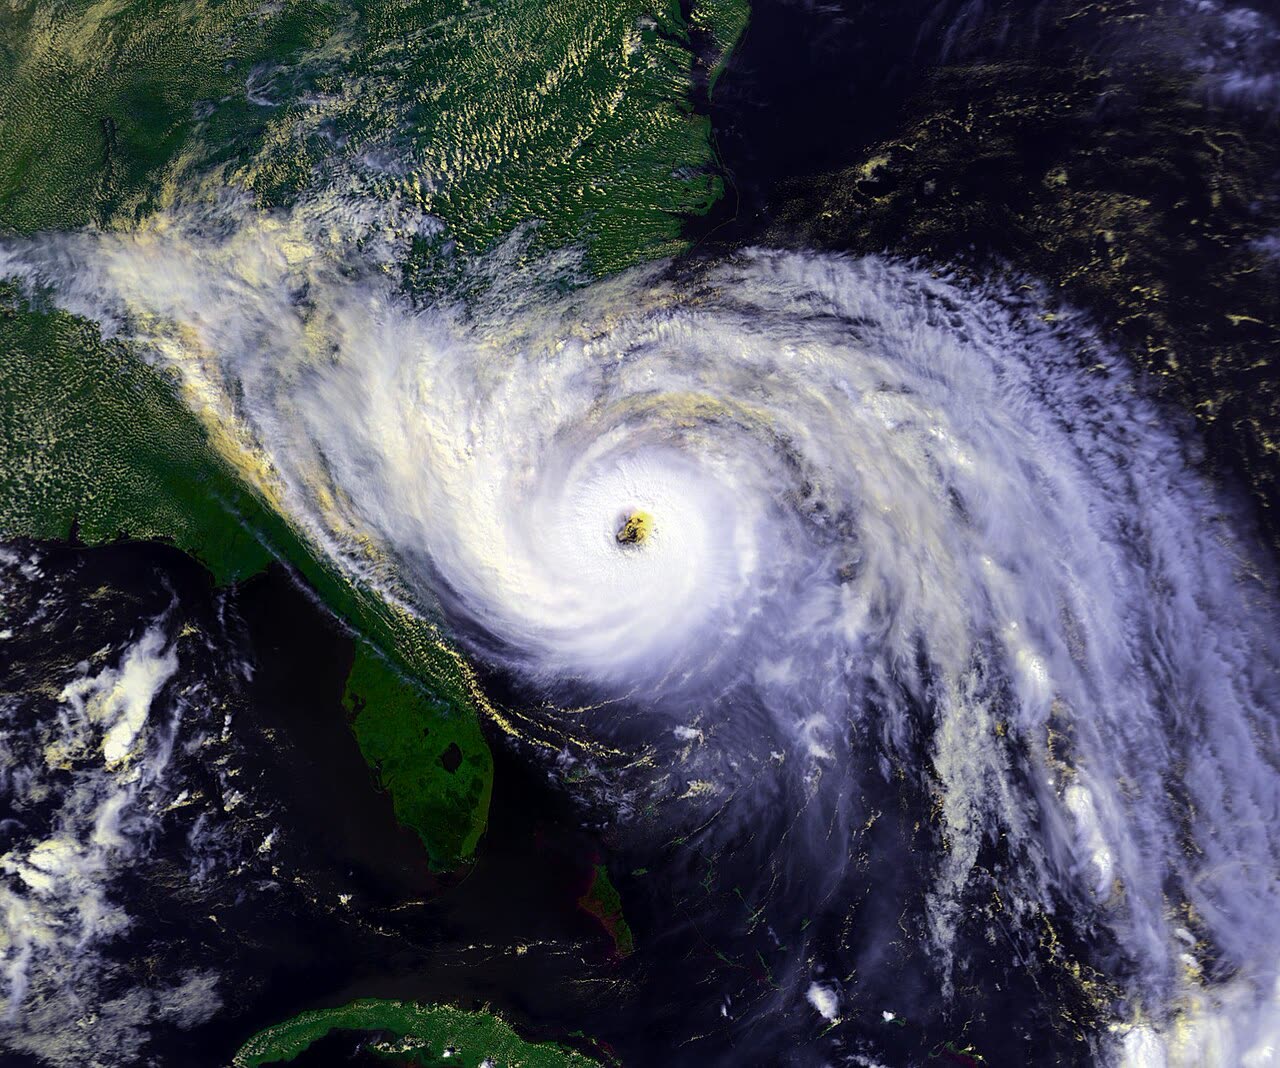
CAT 2 · 145 MPH 27.2°N 80.2°W
Hurricane Frances
2004 · Hutchinson Island, FL (near Stuart)

Thousands of Charley-hit homes owed a second hurricane deductible three weeks later — the outcry produced Florida's single-season deductible law

Hurricane Ivan
CAT 3 · 165 MPH 30.2°N 87.9°W
Hurricane Ivan
2004 · Gulf Shores, AL (core impact Pensacola / Perdido Key)

Beachfront slabs from Perdido Key to Orange Beach previewed Katrina's wind-vs-flood fight a year early

Hurricane Jeanne
CAT 3 · 120 MPH 27.2°N 80.3°W
Hurricane Jeanne
2004 · Hutchinson Island, FL (east of Stuart) — same island Frances struck 21 days earlier

Struck the same island as Frances three weeks later — adjusters split single wrecked roofs between two storms, two claims, two deductibles

Hurricane Georges
2 (FL) · 155 MPH 24.6°N 81.8°W
Hurricane Georges
1998 · Key West, FL → Biloxi, MS

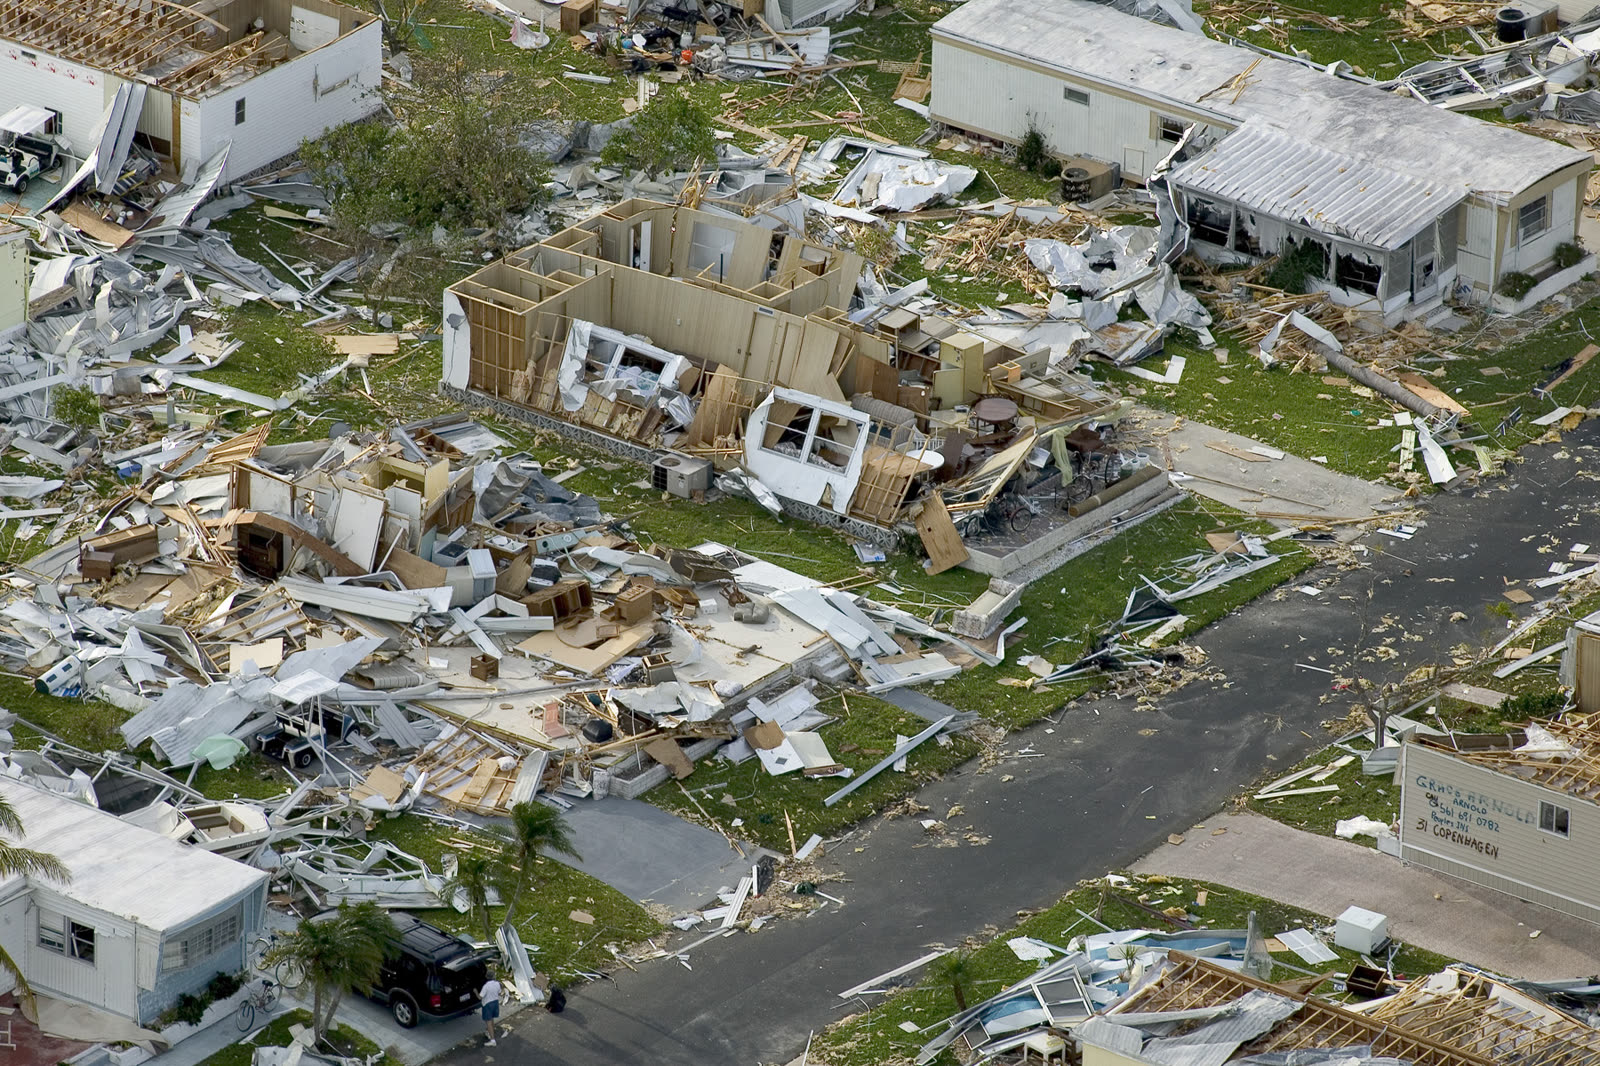
173 Keys homes destroyed — many of them mobile homes — reigniting the fight over whether trailers belong in a surge zone at all

Hurricane Opal
CAT 3 · 150 MPH 30.3°N 87.1°W
Hurricane Opal
1995 · Pensacola Beach, FL

$2.1B in insured losses three years after Andrew — Opal's claims drove $117M in wind-pool assessments and swelled the FWUA

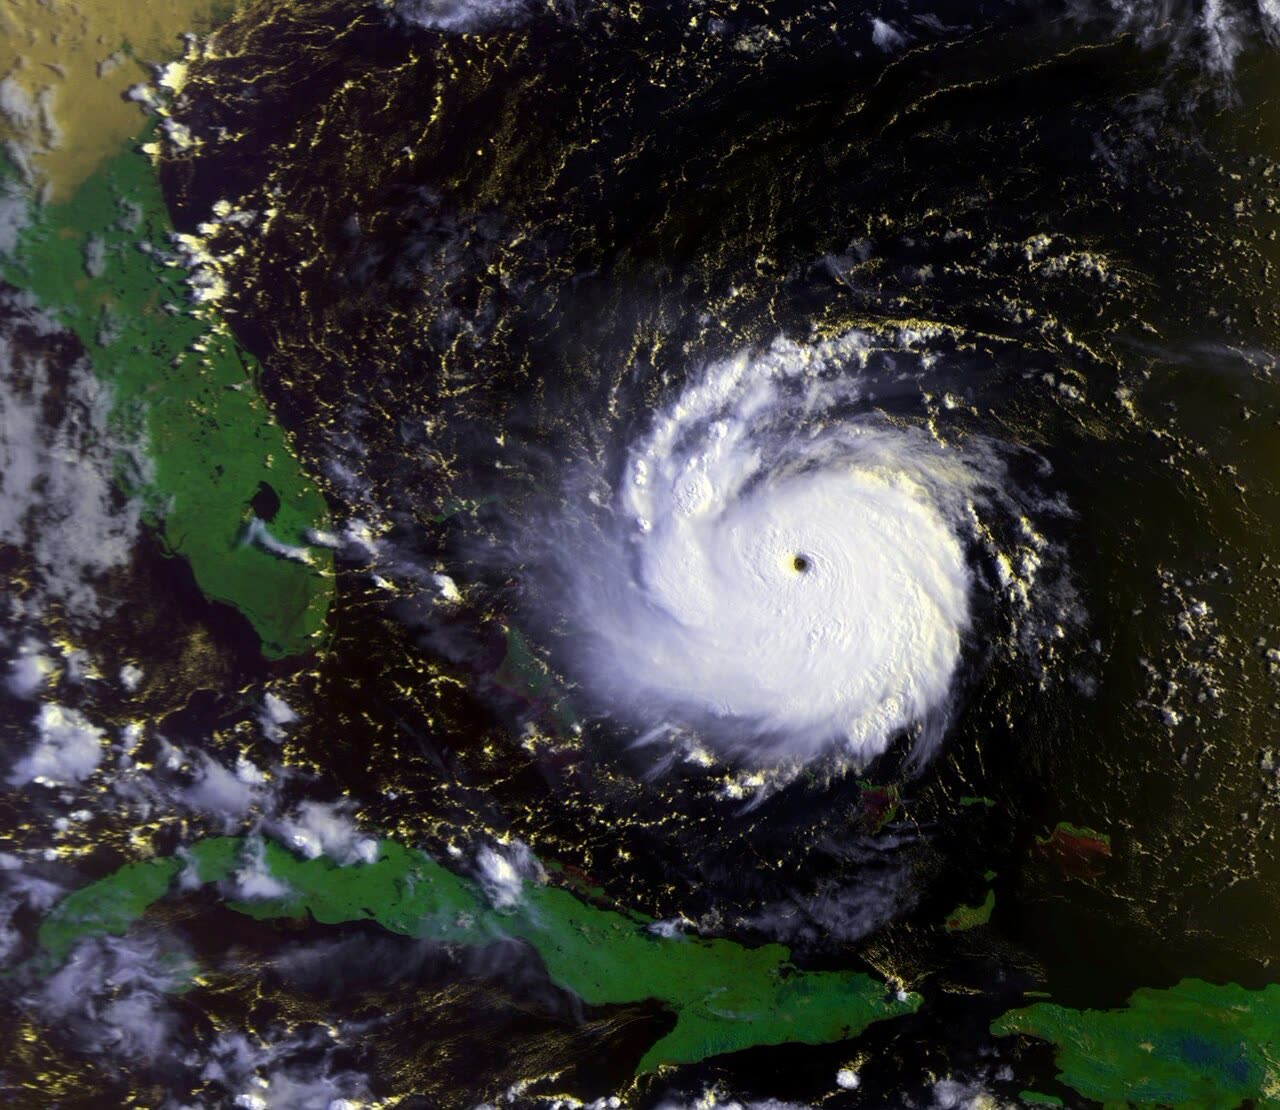
Hurricane Andrew
CAT 5 · 175 MPH 25.5°N 80.3°W
Hurricane Andrew
1992 · Homestead / Florida City, FL

Bankrupted at least 8 insurers and forced Florida to invent its modern insurance system — the Cat Fund, the state-run insurer that became Citizens, and the statewide building code.

Hurricane David
CAT 2 · 175 MPH 31.5°N 81.2°W
Hurricane David
1979 · Near Blackbeard Island, GA (eye over Savannah

About 400,000 people evacuated the Southeast coast ahead of David — the first mass-evacuation test of the modern South Carolina shoreline

Hurricane Eloise
CAT 3 · 125 MPH
Hurricane Eloise
1975 · Panama City Beach, FL

Eloise wiped out beachfront rows in Bay County and became the storm that put teeth in Florida's Coastal Construction Control Line

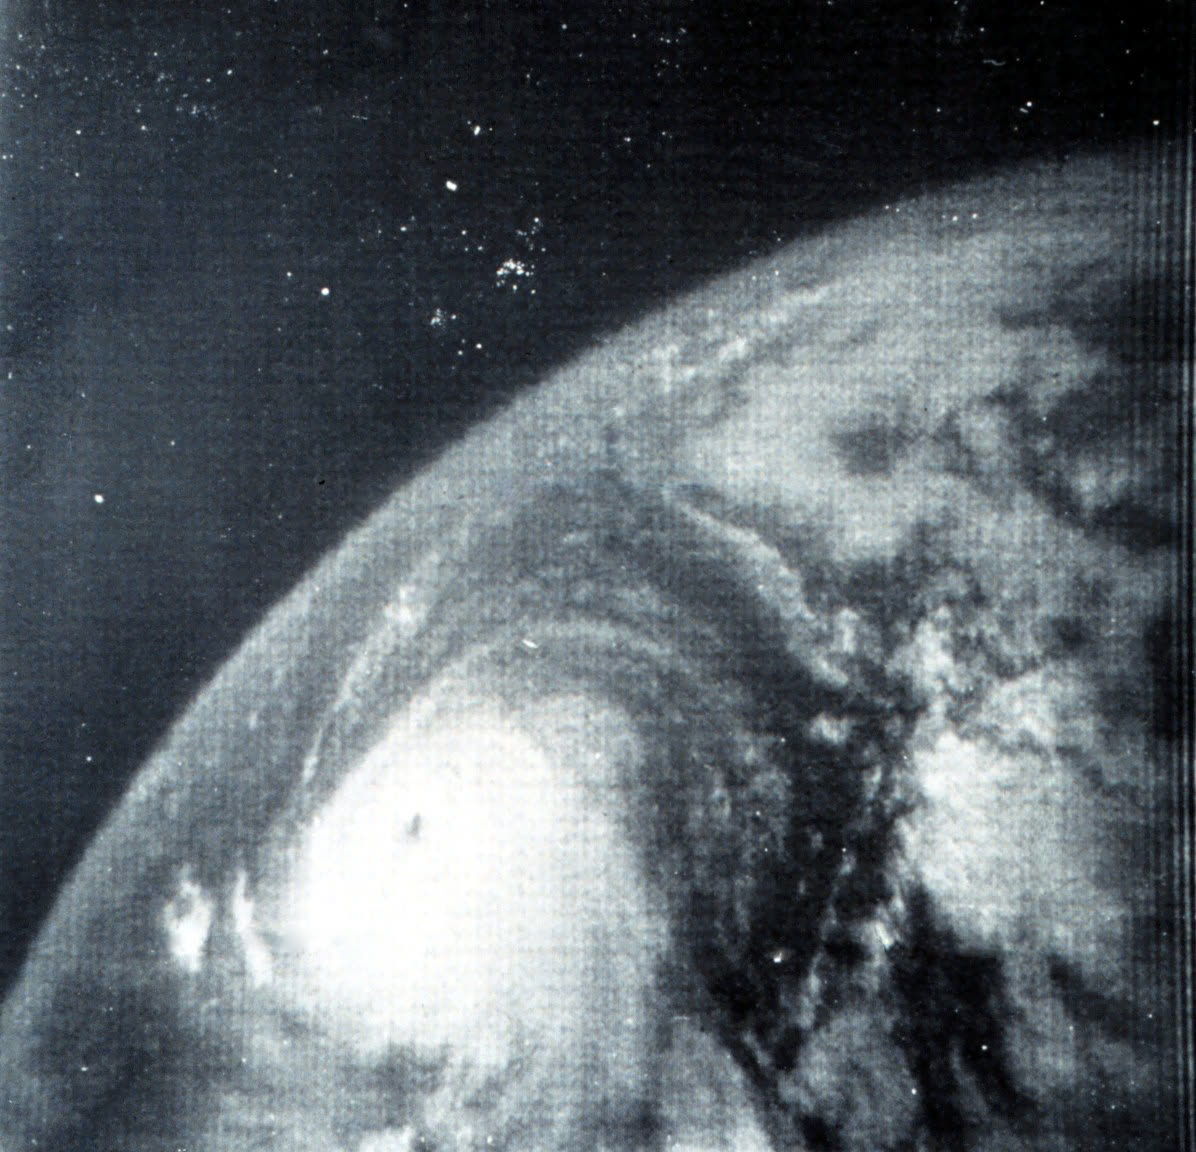
Hurricane Agnes
CAT 1 · 85 MPH 30.1°N 85.7°W
Hurricane Agnes
1972 · Near Panama City, FL Panhandle

Less than 1% of Agnes's insurable flood damage was covered — fewer than 100,000 NFIP policies existed nationwide — and Congress answered with the Flood Disaster Protection Act of 1973's mandatory purchase rule

Hurricane Betsy
3 (FL) · 155 MPH 25.2°N 80.4°W
Hurricane Betsy
1965 · Key Largo, FL → Grand Isle, LA

America's first billion-dollar hurricane — the loss that pushed Congress to create the National Flood Insurance Program in 1968

Hurricane Dora
2-3 · 125 MPH 29.9°N 81.3°W
Hurricane Dora
1964 · St. Augustine, FL

The only hurricane on record to strike Northeast Florida head-on — the storm insurers still use to price Jacksonville's risk

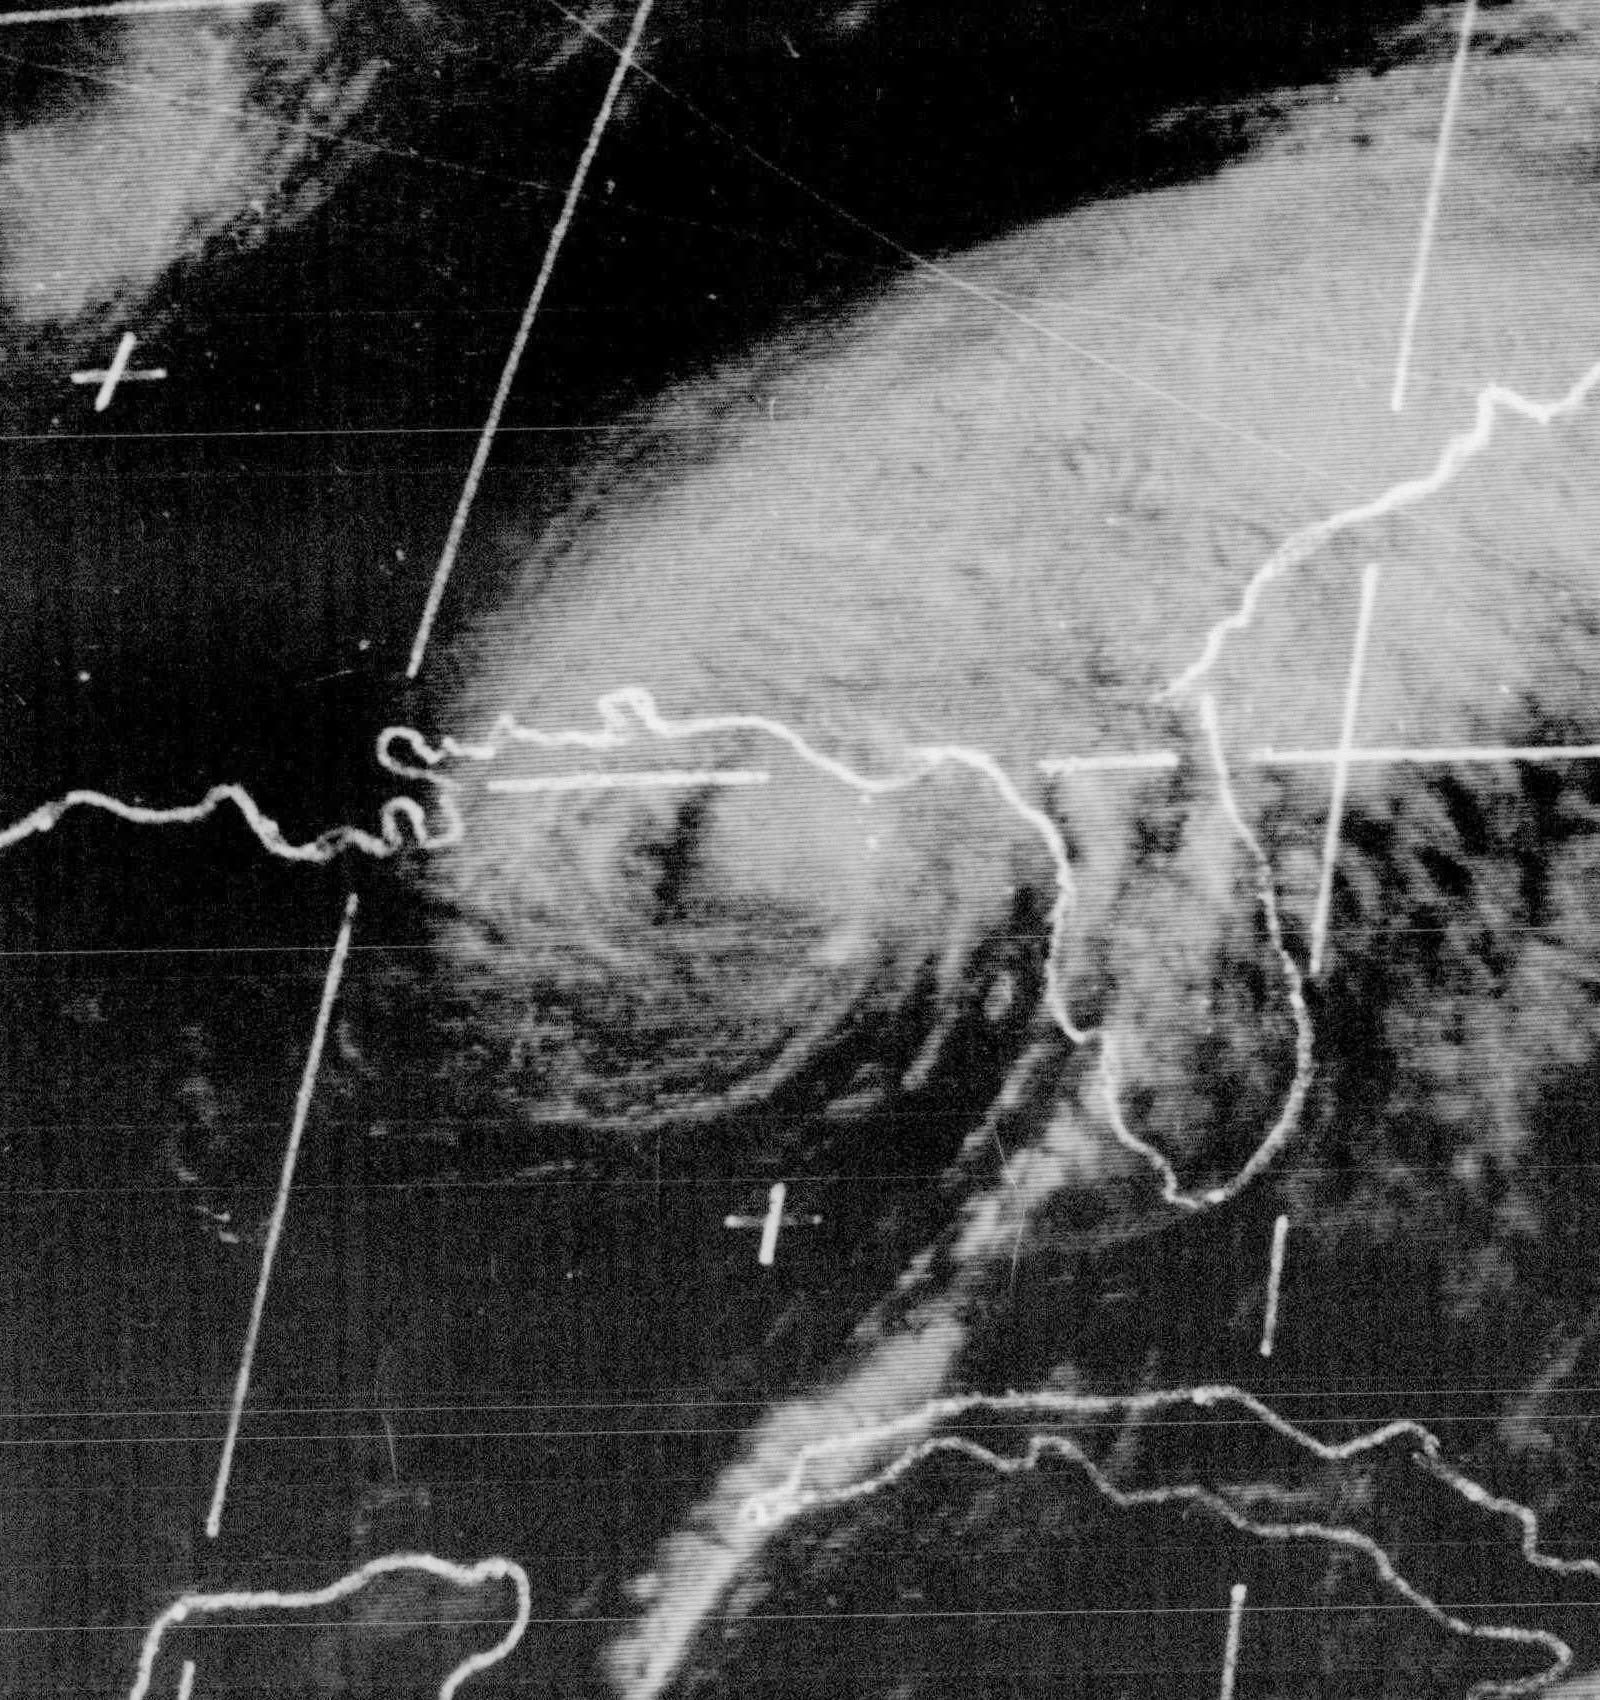
Hurricane Donna
CAT 4 · 160 MPH 24.8°N 80.9°W
Hurricane Donna
1960 · Middle Florida Keys → Naples, FL

The only hurricane on record to bring hurricane-force winds to Florida, the mid-Atlantic, and New England — and the catastrophe-ratemaking benchmark of its era

Hurricane King
CAT 4 · 130 MPH 25.7°N 80.2°W
Hurricane King
1950 · Downtown Miami, FL

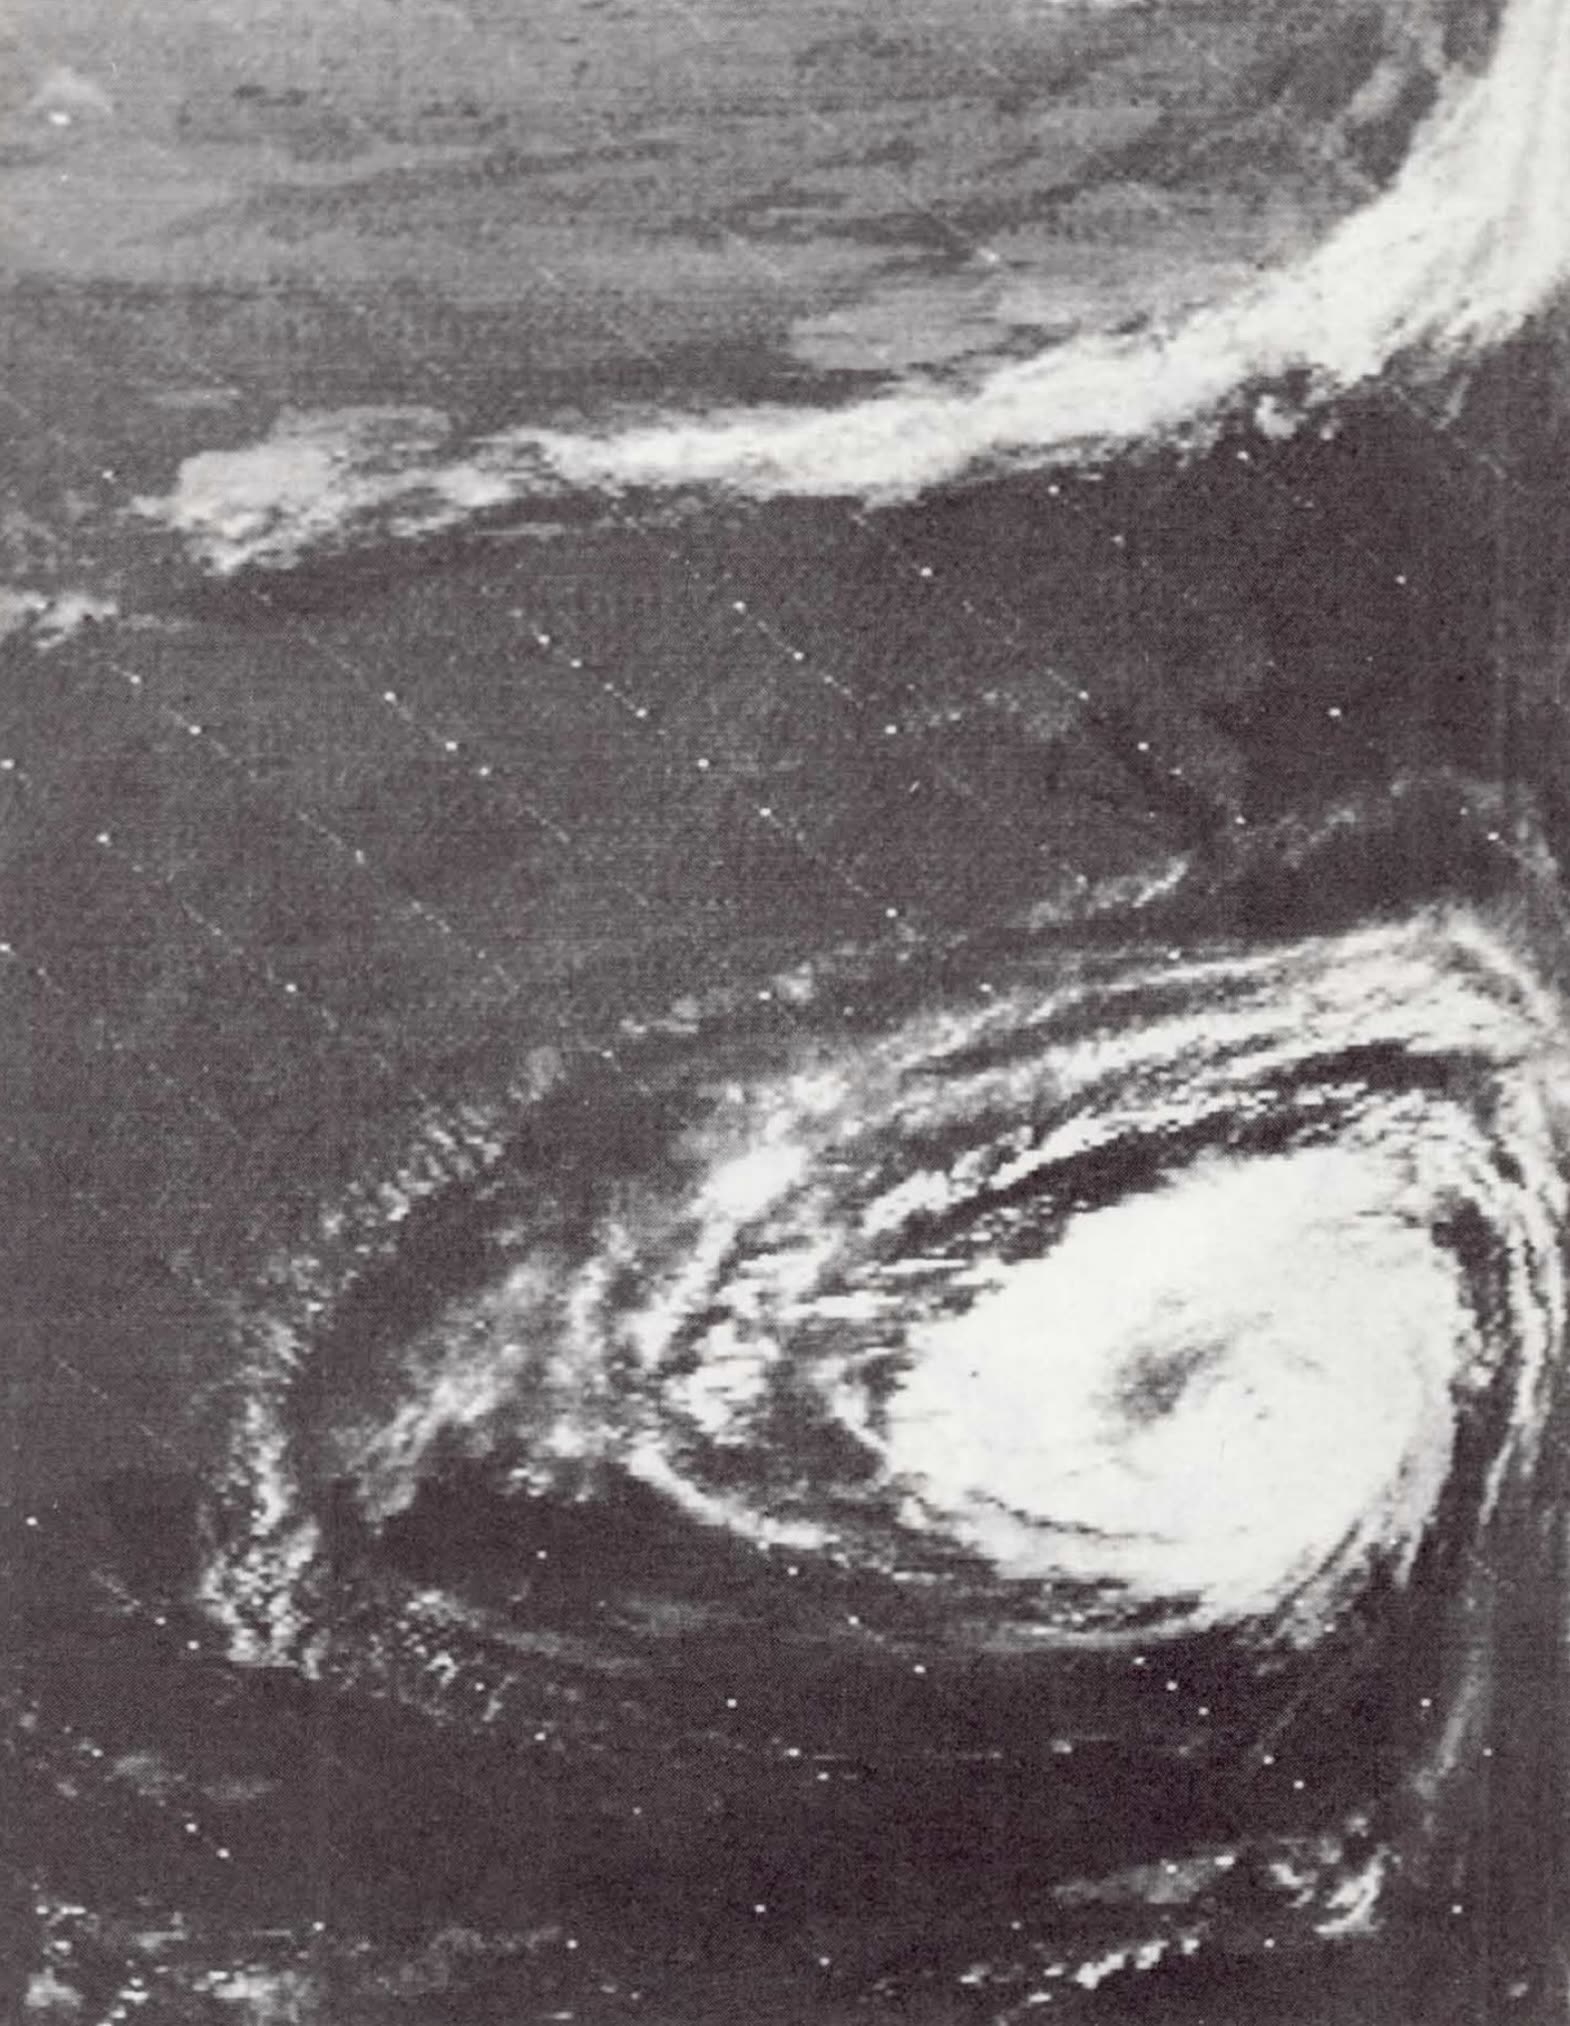
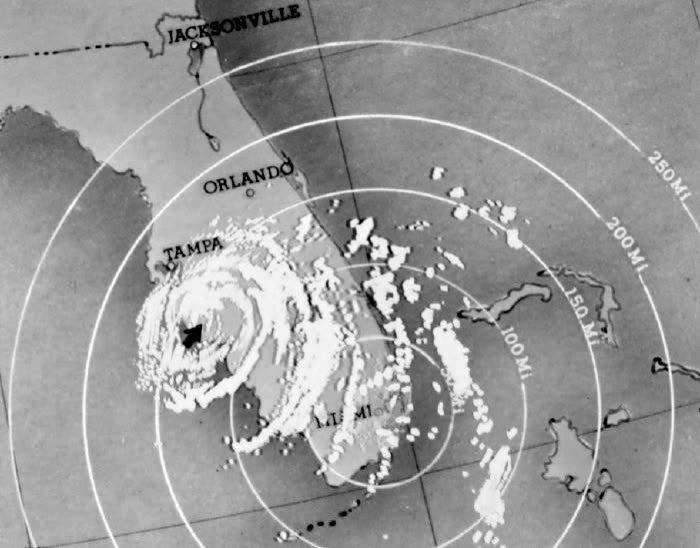
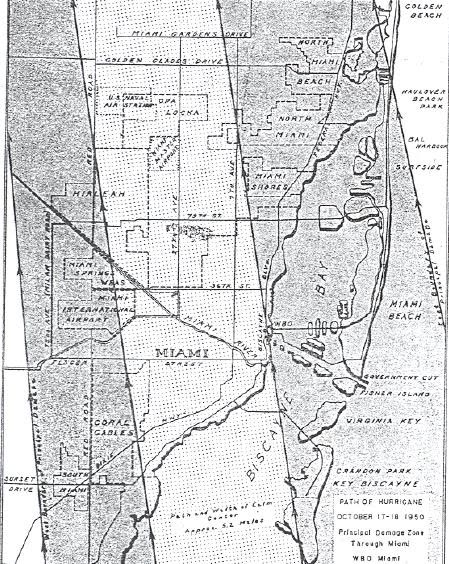
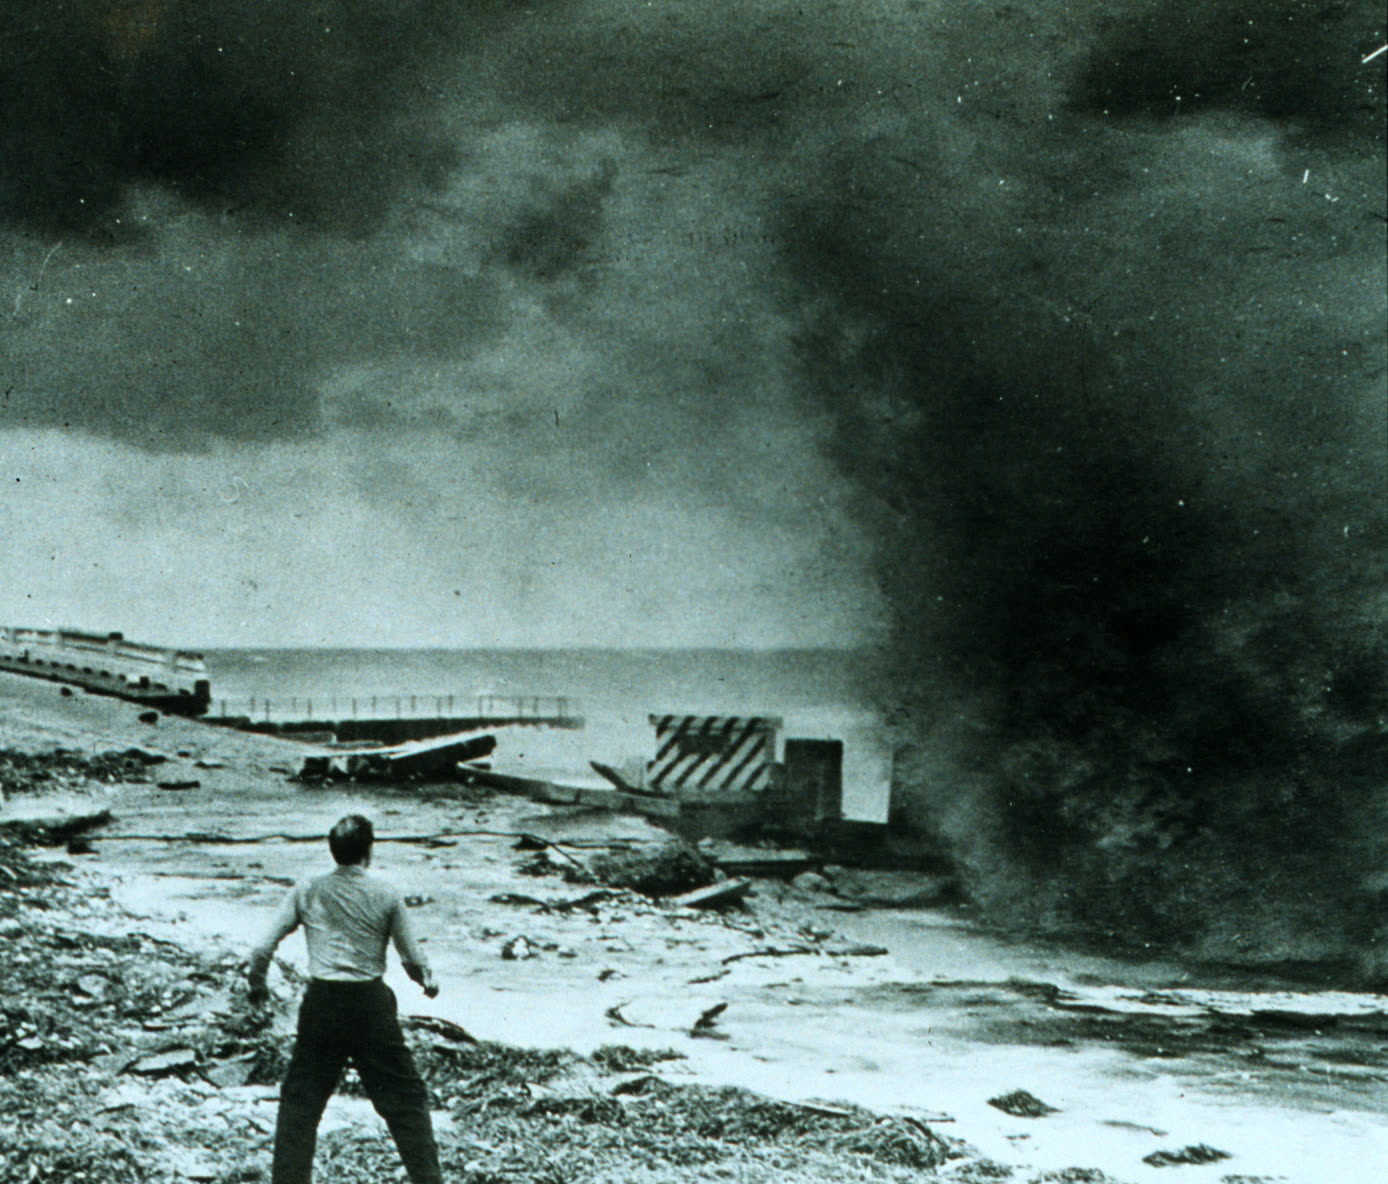
A Category 4 core five miles wide through downtown Miami — 20,861 homes damaged — still cited as the benchmark for concentrated urban wind exposure

Fort Lauderdale Hurricane
CAT 4 · ~155 MPH 26.3°N 80.1°W
Fort Lauderdale Hurricane
1947 · Fort Lauderdale / Pompano Beach, FL

Its floods drowned 2,000+ square miles of South Florida for months and pushed Congress to build the Central & Southern Florida Flood Control Project — engineering in place of the flood insurance that didn't exist

Labor Day Hurricane
CAT 5 · 185 MPH 24.8°N 80.8°W
Labor Day Hurricane
1935 · Upper Florida Keys (Long Key / Islamorada)

Still the most intense U.S. landfall ever recorded — 892 mb; the dead were federal relief workers, and compensation came from Congress, not carriers

Okeechobee Hurricane
CAT 4 · 160 MPH 26.7°N 80.0°W
Okeechobee Hurricane
1928 · West Palm Beach, FL

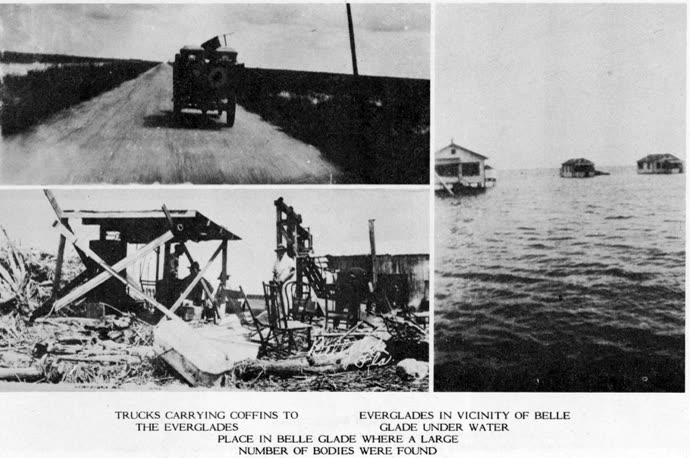
The lake dike failure that killed 2,500+ produced the Herbert Hoover Dike — federal flood control as the answer to an uninsurable peril, four decades before flood insurance existed

Great Miami Hurricane
CAT 4 · 150 MPH 25.6°N 80.3°W
Great Miami Hurricane
1926 · Miami / Coconut Grove, FL

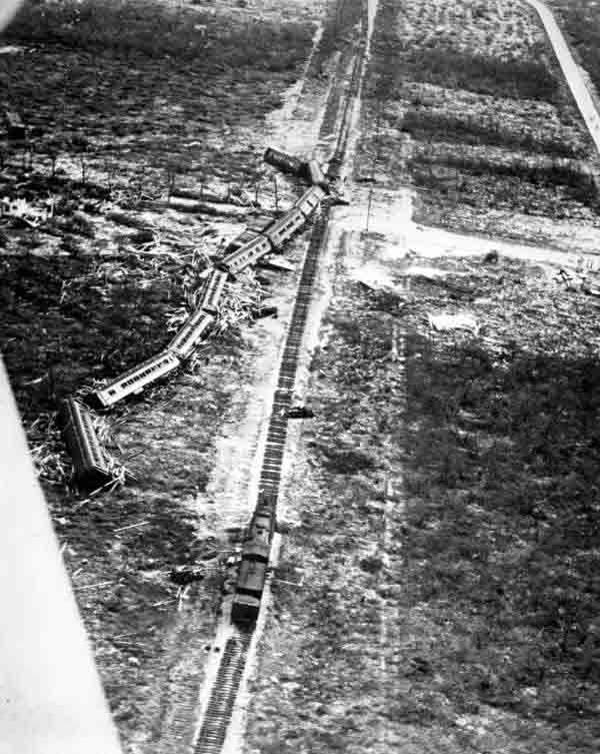
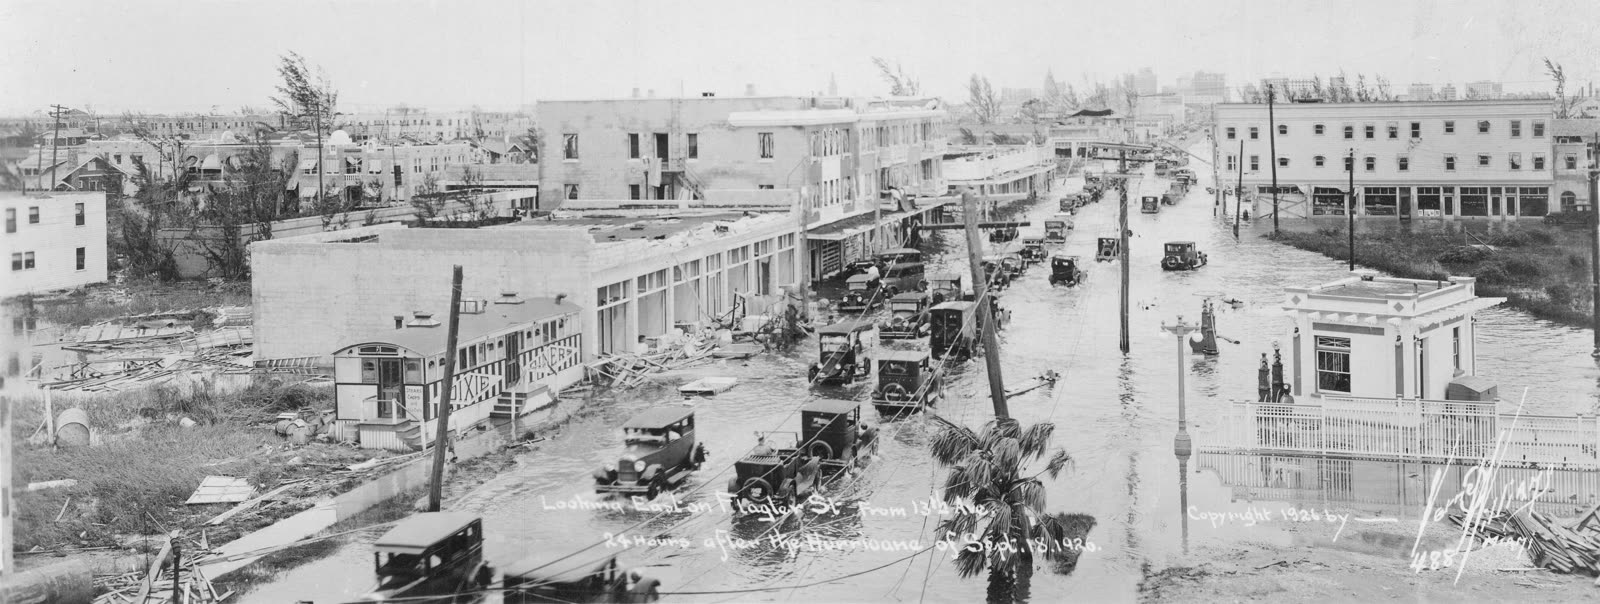
Burst the Florida land boom — and remains the costliest U.S. hurricane ever when normalized to today's coastline, at $200B+

02 SOUTH CAROLINA LANDFALLS
15 STORMS

South Carolina

Hurricane Debby
CAT 1 · 80 MPH 29.7°N 83.4°W
Hurricane Debby
2024 · Steinhatchee, FL

Debby's wind was a footnote — its stalled rain flooded Sarasota, Savannah, and the SC Lowcountry, and most of that water hit homes with no flood policy

Hurricane Helene
CAT 4 · 140 MPH
Hurricane Helene
2024 · Big Bend, FL (near Perry)

42% of Helene–Milton residential claims closed without payment — most flood losses had no flood policy behind them

Hurricane Ian
CAT 4 · 160 MPH 26.6°N 82.2°W
Hurricane Ian
2022 · Cayo Costa / Fort Myers Beach, FL

Florida's costliest hurricane: 700,000+ claims, roughly 3 in 10 residential claims closed without payment, a surge-vs-wind litigation wave, and the SB 2-A overhaul of Florida claim law.

Hurricane Dorian
OFFSHORE · 185 MPH 35.2°N 75.5°W (Cape Hatteras landfall)
Hurricane Dorian
2019 · No SC landfall — closest approach off Charleston

Dorian never touched South Carolina, but it closed the coast for a week — proving that business-interruption and evacuation losses rarely collect without physical damage

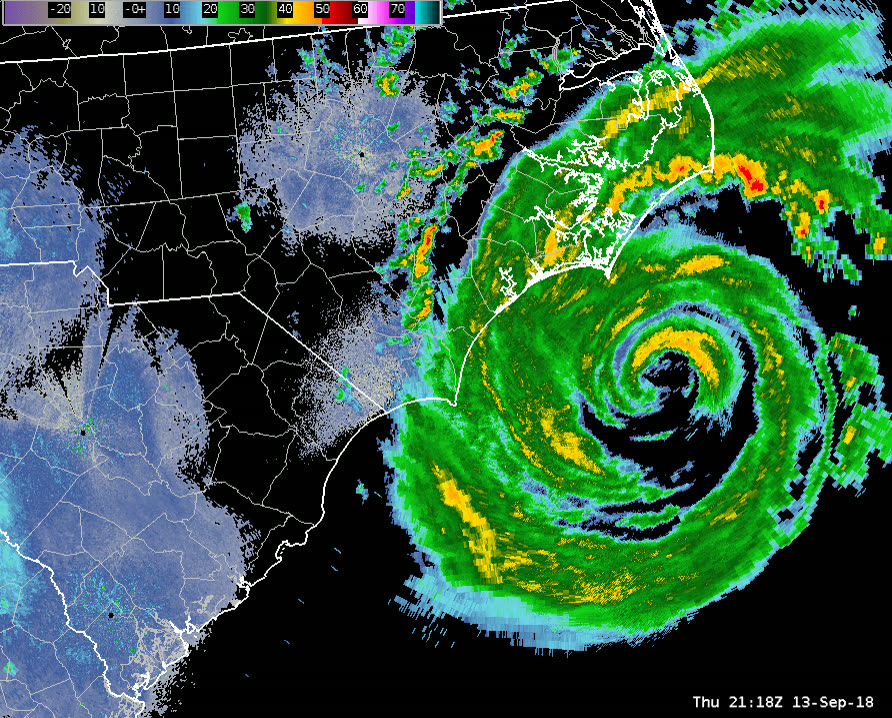
Hurricane Florence
CAT 1 · 150 MPH 34.2°N 77.8°W
Hurricane Florence
2018 · Wrightsville Beach, NC

Insured wind losses stayed modest while uninsured flood damage ran toward $20B — and Nichols, SC drowned for the second time in 23 months, the NFIP repetitive-loss problem in one town

Hurricane Matthew
CAT 1 · 165 MPH 33.0°N 79.6°W
Hurricane Matthew
2016 · McClellanville, SC — after paralleling the entire FL east coast offshore

Matthew never made a Florida landfall — and still generated 100,000+ Florida claims, proving a near-miss can be a full-scale insurance event

The 2015 South Carolina Floods
OFFSHORE · 155 MPH
The 2015 South Carolina Floods
2015 · No landfall — 1,000-year rain event, Columbia to Charleston (Hurricane Joaquin offshore)

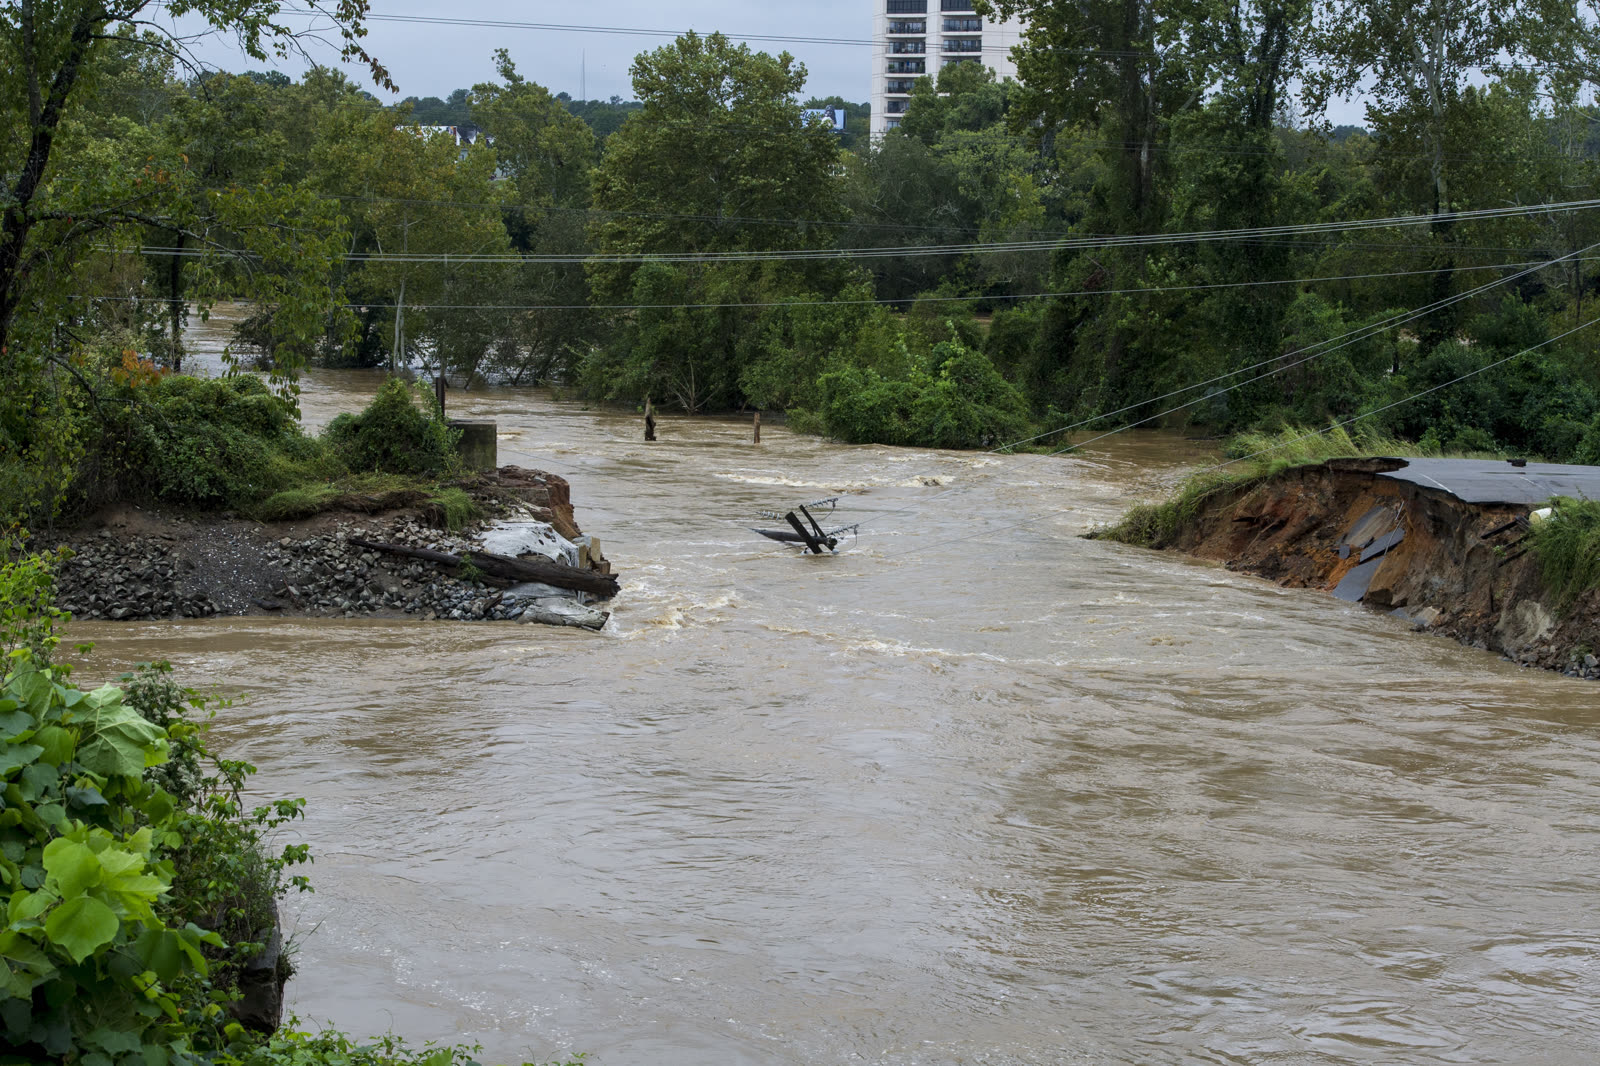
NFIP take-up in the declared counties averaged about 5% — South Carolina's costliest flood hit the inland counties where almost no one had flood insurance

Hurricane Charley
CAT 4 · 150 MPH 26.6°N 82.2°W
Hurricane Charley
2004 · Cayo Costa / Punta Gorda, FL

A court ruling weeks before landfall — Mierzwa — put full policy limits on the table for mixed-peril total losses; the 2005 Legislature rewrote the Valued Policy Law in response

Hurricane Gaston
CAT 1 · 75 MPH 33.0°N 79.6°W
Hurricane Gaston
2004 · Awendaw, SC (Bulls Bay)

Wind at the SC coast, a 1,000-year flash flood in Richmond — where the flood wall had taken Shockoe Bottom off the flood maps, so almost nobody carried flood insurance

Hurricane Frances
CAT 2 · 145 MPH 27.2°N 80.2°W
Hurricane Frances
2004 · Hutchinson Island, FL (near Stuart)

Thousands of Charley-hit homes owed a second hurricane deductible three weeks later — the outcry produced Florida's single-season deductible law

Hurricane Hugo
CAT 4 · 160 MPH 32.8°N 79.8°W
Hurricane Hugo
1989 · Sullivan's Island / Charleston, SC

The first US catastrophe to top $4 billion in insured claims — it exposed how unprepared insurers and coastal South Carolina were, and pushed the SC wind pool into its modern role.

Hurricane David
CAT 2 · 175 MPH 31.5°N 81.2°W
Hurricane David
1979 · Near Blackbeard Island, GA (eye over Savannah

About 400,000 people evacuated the Southeast coast ahead of David — the first mass-evacuation test of the modern South Carolina shoreline

Hurricane Gracie
CAT 4 · 140 MPH 32.5°N 80.4°W
Hurricane Gracie
1959 · St. Helena Sound, SC (near Edisto Island)

The last major hurricane to hit South Carolina before Hugo — a 30-year gap that drained coastal storm experience from owners, carriers, and adjusters alike

Hurricane Hazel
CAT 4 · 130 MPH 33.9°N 78.5°W
Hurricane Hazel
1954 · NC/SC state line at Little River Inlet

80% of Myrtle Beach's waterfront dwellings were destroyed on the year's highest lunar tide — 14 years before federal flood insurance existed

Sea Islands Hurricane
CAT 3 · 120 MPH
Sea Islands Hurricane
1893 · Beaufort sea islands, SC (center ashore near Savannah, GA)

No insurance and no government aid existed — recovery ran entirely on the Red Cross's first major disaster-relief operation, privately funded for 10 months

03 FAMOUS U.S. LANDFALLS
21 STORMS

Famous U.S. storms

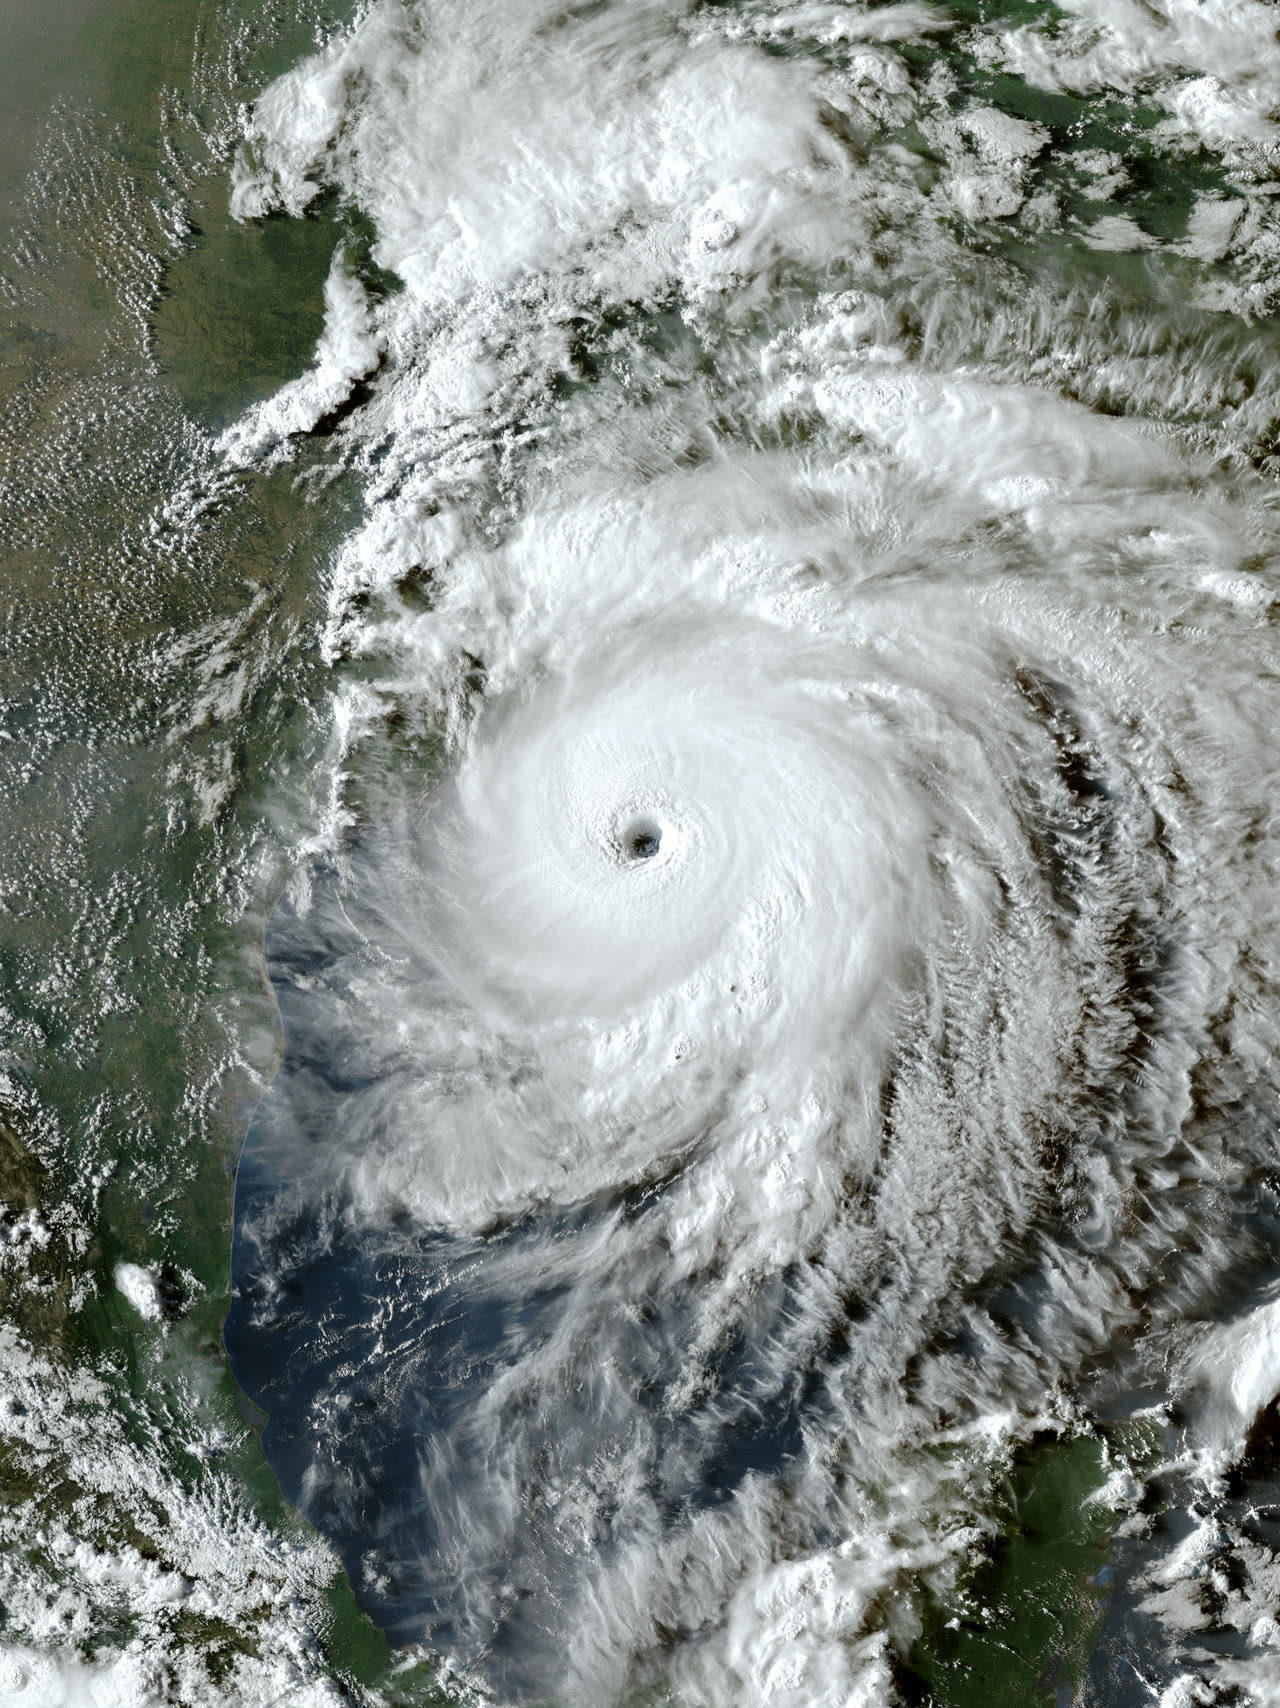
Hurricane Ida
CAT 4 · 150 MPH 29.1°N 90.2°W
Hurricane Ida
2021 · Port Fourchon, LA

Ida drew 460,000+ Louisiana claims and $13.1B in payouts — 11 insurers failed and Louisiana Citizens more than tripled

Hurricane Laura
CAT 4 · 150 MPH 29.8°N 93.3°W
Hurricane Laura
2020 · Cameron, LA

Laura opened Louisiana's insurance death spiral — four hurricanes in 13 months, $23B+ insured losses, and a dozen carrier failures

Hurricane Dorian
OFFSHORE · 185 MPH 35.2°N 75.5°W (Cape Hatteras landfall)
Hurricane Dorian
2019 · No SC landfall — closest approach off Charleston

Dorian never touched South Carolina, but it closed the coast for a week — proving that business-interruption and evacuation losses rarely collect without physical damage

Hurricane Florence
CAT 1 · 150 MPH 34.2°N 77.8°W
Hurricane Florence
2018 · Wrightsville Beach, NC

Insured wind losses stayed modest while uninsured flood damage ran toward $20B — and Nichols, SC drowned for the second time in 23 months, the NFIP repetitive-loss problem in one town

Hurricane Harvey
CAT 4 · 130 MPH 28.0°N 96.8°W
Hurricane Harvey
2017 · San Jose Island / Rockport, TX

Roughly 80% of flooded Harris County homes had no flood insurance — and 63% of Harvey homeowners claims closed without payment

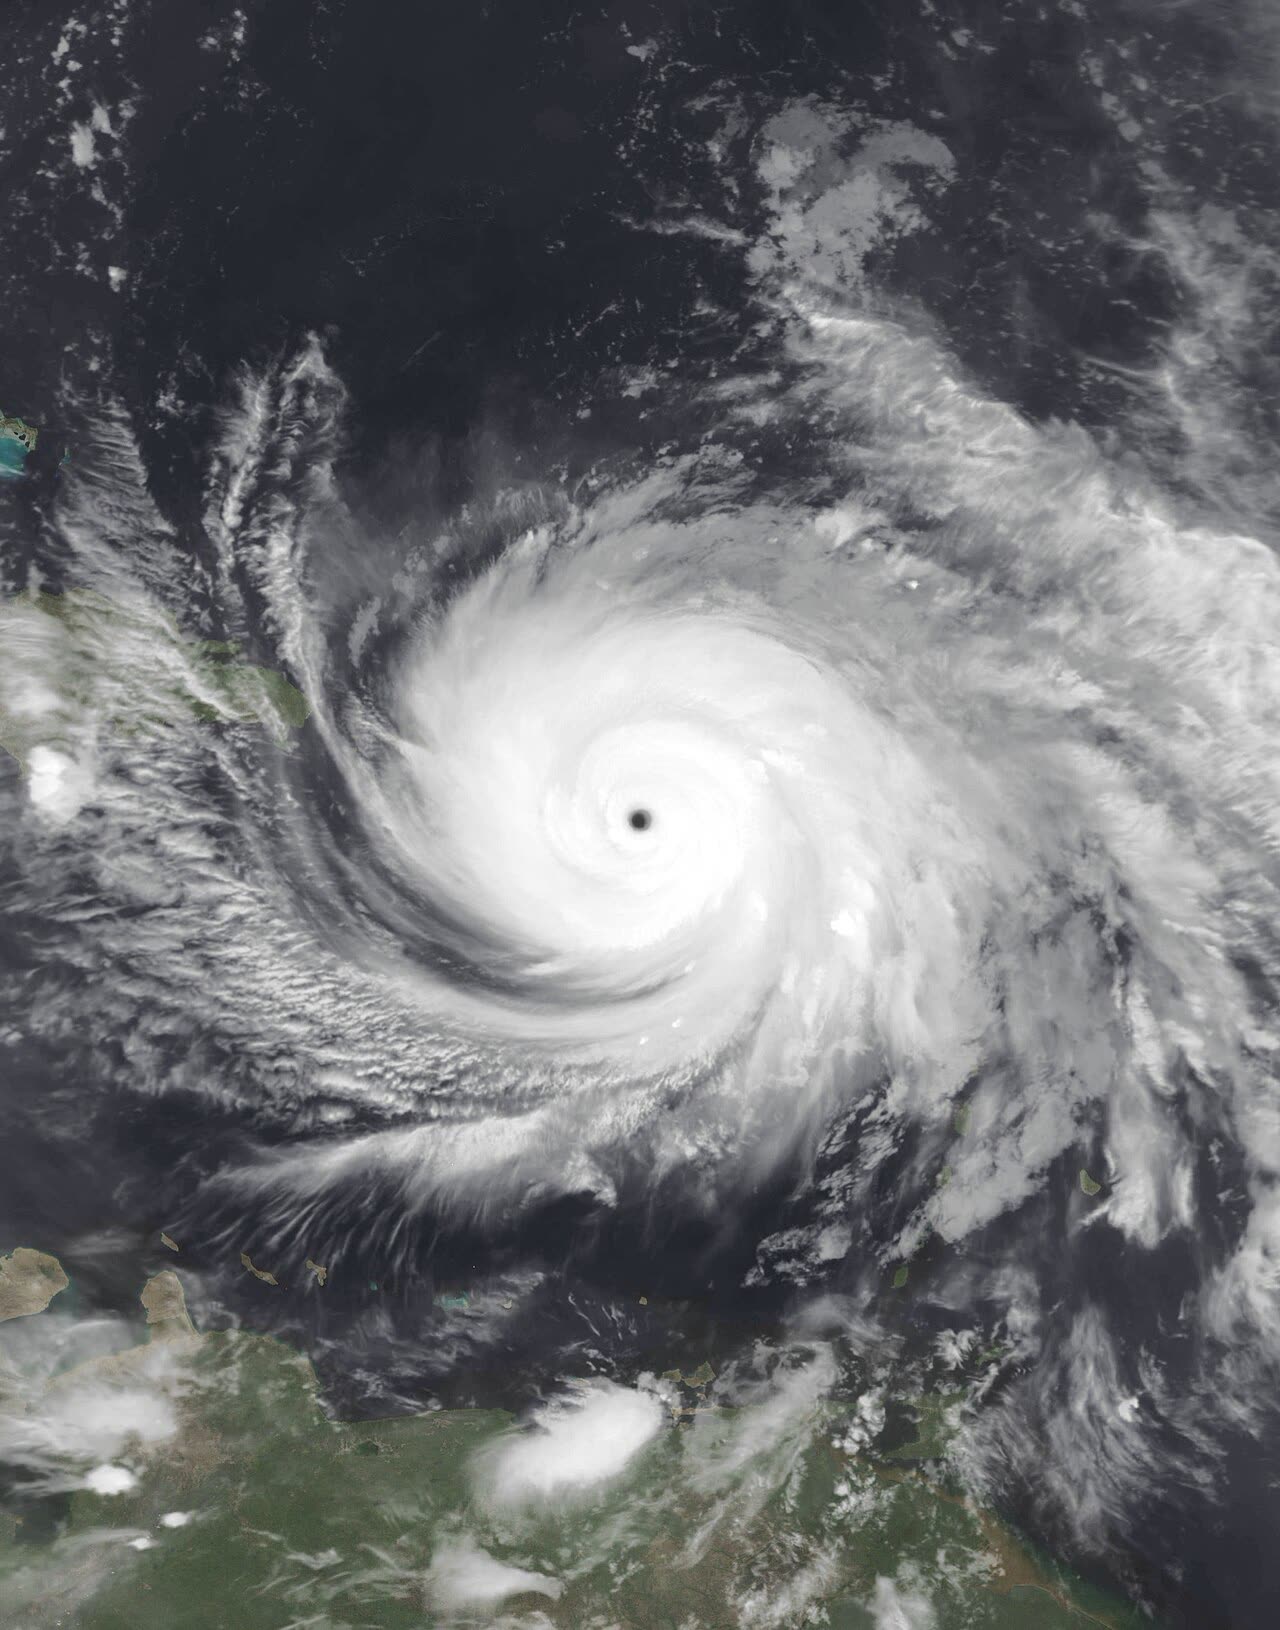
Hurricane Maria
CAT 4 · 175 MPH 18.0°N 65.9°W
Hurricane Maria
2017 · Yabucoa, Puerto Rico

A year after Maria, ~13,600 Puerto Rico claims were still open — the delay crisis produced bad-faith reforms and an insurer liquidation

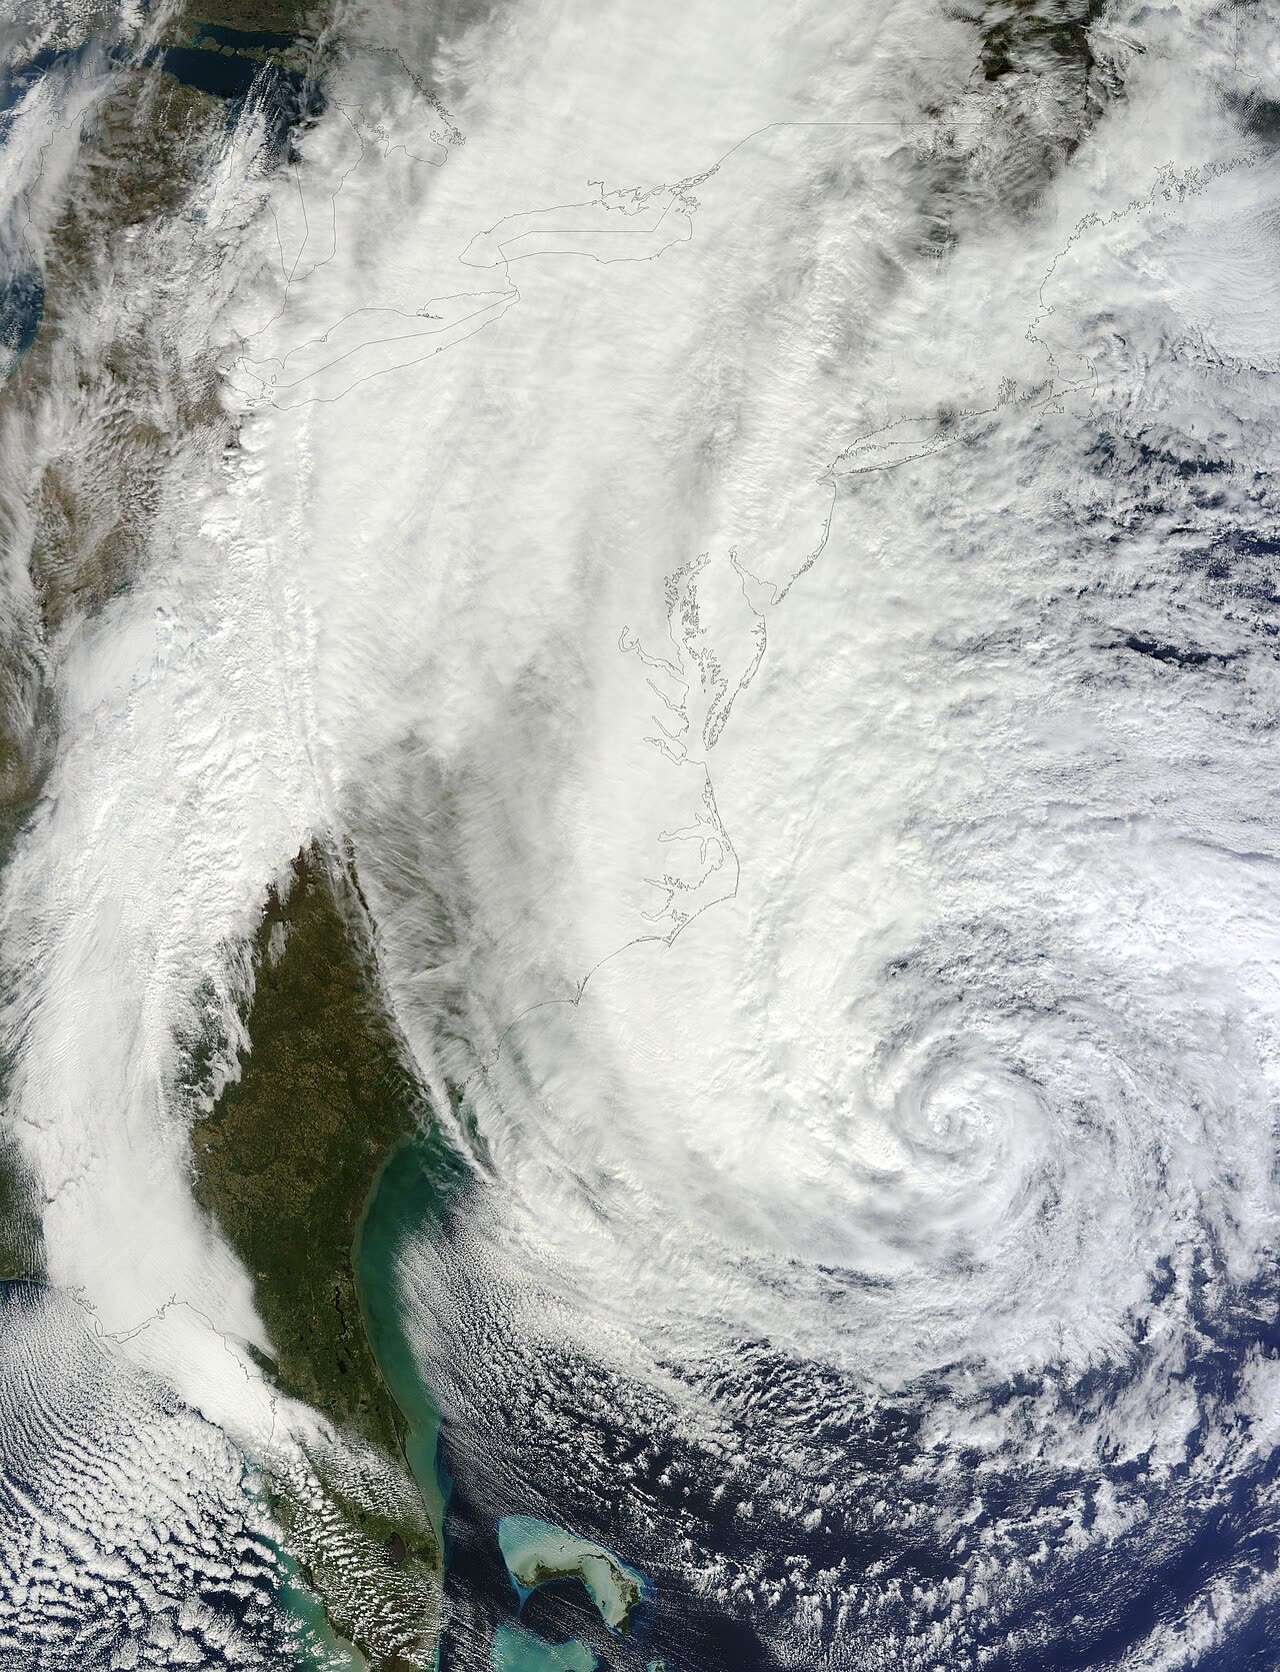
Hurricane Sandy
POST-TROPICAL · 115 MPH 39.4°N 74.4°W
Hurricane Sandy
2012 · Brigantine, NJ

Post-tropical at landfall, so hurricane deductibles were voided — then FEMA reopened ~142,000 NFIP claims over altered engineering reports

Hurricane Ike
CAT 2 · 145 MPH 29.3°N 94.7°W
Hurricane Ike
2008 · Galveston, TX

TWIA paid $2.3B on ~93,000 Ike claims, then thousands of lawsuits nearly sank it — Texas rewrote windstorm-claim law in 2011

Hurricane Katrina
CAT 3 · 175 MPH
Hurricane Katrina
2005 · Buras, LA

Largest NFIP payout in history ($16.3B) — and the wind-vs-water litigation that still defines hurricane claim denials

Hurricane Rita
CAT 3 · 180 MPH 29.7°N 93.6°W
Hurricane Rita
2005 · Johnson Bayou, LA (Texas–Louisiana line)

Rita caused $18.5B in damage but only $5.6B in insured payouts — the surge that leveled Cameron Parish was excluded as flood

Hurricane Gaston
CAT 1 · 75 MPH 33.0°N 79.6°W
Hurricane Gaston
2004 · Awendaw, SC (Bulls Bay)

Wind at the SC coast, a 1,000-year flash flood in Richmond — where the flood wall had taken Shockoe Bottom off the flood maps, so almost nobody carried flood insurance

Hurricane Ivan
CAT 3 · 165 MPH 30.2°N 87.9°W
Hurricane Ivan
2004 · Gulf Shores, AL (core impact Pensacola / Perdido Key)

Beachfront slabs from Perdido Key to Orange Beach previewed Katrina's wind-vs-flood fight a year early

Hurricane Georges
2 (FL) · 155 MPH 24.6°N 81.8°W
Hurricane Georges
1998 · Key West, FL → Biloxi, MS

173 Keys homes destroyed — many of them mobile homes — reigniting the fight over whether trailers belong in a surge zone at all

Hurricane David
CAT 2 · 175 MPH 31.5°N 81.2°W
Hurricane David
1979 · Near Blackbeard Island, GA (eye over Savannah

About 400,000 people evacuated the Southeast coast ahead of David — the first mass-evacuation test of the modern South Carolina shoreline

Hurricane Agnes
CAT 1 · 85 MPH 30.1°N 85.7°W
Hurricane Agnes
1972 · Near Panama City, FL Panhandle

Less than 1% of Agnes's insurable flood damage was covered — fewer than 100,000 NFIP policies existed nationwide — and Congress answered with the Flood Disaster Protection Act of 1973's mandatory purchase rule

Hurricane Camille
CAT 5 · 175 MPH 30.3°N 89.3°W
Hurricane Camille
1969 · Near Waveland / Pass Christian, MS

Camille's surge denials produced the Mississippi wind-vs-water case law — Byrne, Lunday, Grace — still cited for and against policyholders decades later after Katrina

Hurricane Betsy
3 (FL) · 155 MPH 25.2°N 80.4°W
Hurricane Betsy
1965 · Key Largo, FL → Grand Isle, LA

America's first billion-dollar hurricane — the loss that pushed Congress to create the National Flood Insurance Program in 1968

Hurricane Audrey
CAT 3 · 125 MPH 29.8°N 93.9°W
Hurricane Audrey
1957 · Between Sabine Pass, TX and Cameron, LA

With no flood program until 1968, Audrey's surge losses were unpayable — survivors sued the Weather Bureau over the warnings instead, in Bartie v. United States, the first case of its kind

Hurricane Hazel
CAT 4 · 130 MPH 33.9°N 78.5°W
Hurricane Hazel
1954 · NC/SC state line at Little River Inlet

80% of Myrtle Beach's waterfront dwellings were destroyed on the year's highest lunar tide — 14 years before federal flood insurance existed

New England Hurricane
CAT 3 · 160 MPH 40.7°N 72.9°W
New England Hurricane
1938 · Bellport, Long Island, NY

Windstorm coverage was so rare in 1938 that the storm drove mass adoption of the new extended-coverage endorsement — the ancestor of modern wind coverage — and it remains the return-period benchmark for Northeast catastrophe models

Galveston Hurricane
CAT 4 · 145 MPH 29.1°N 95.1°W
Galveston Hurricane
1900 · Galveston, TX

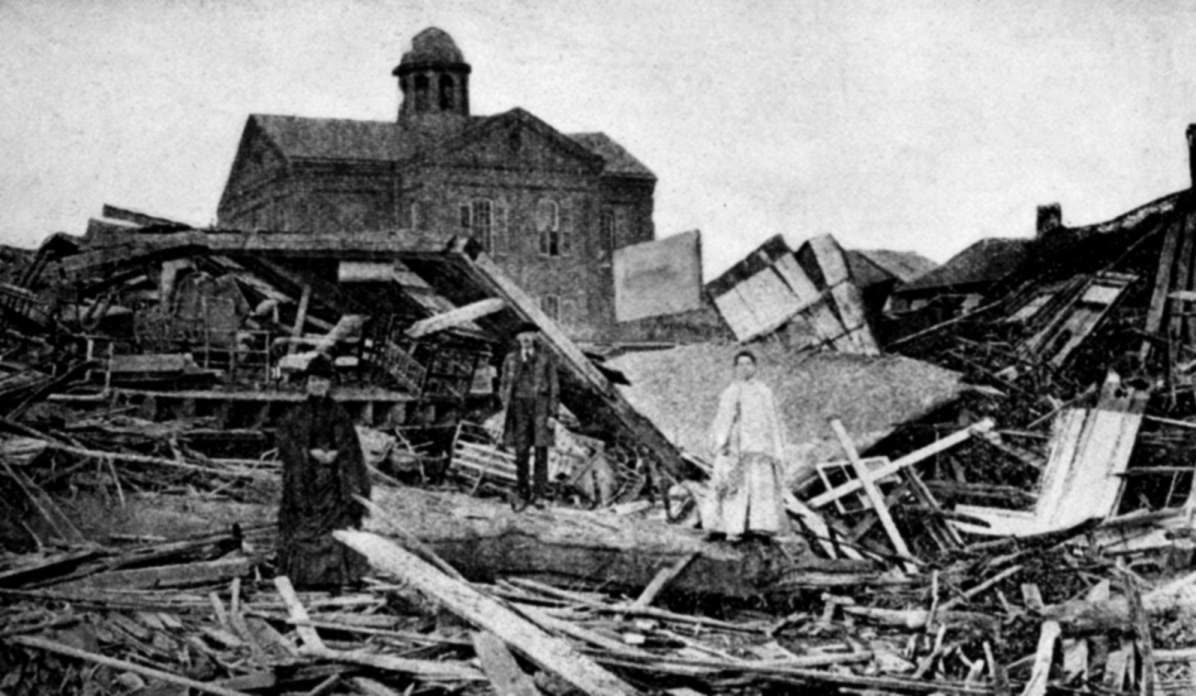
Fire policies dominated in 1900 — windstorm ('tornado') coverage was a rarely purchased rider, so most of the 3,600+ destroyed homes carried no coverage against the storm

OUR LAW FIRM PARTNERHalversen LawFREE CLAIM REVIEW
HurricaneLaw.Pro HURRICANELAW.PRO

The independent policyholder resource for Florida & South Carolina — storm archive, coverage law, denials, bad faith, and the complete claims playbook. 51 storms · 46 carriers · 97 public-adjuster firms · 37 city guides.

▸ SEE THE FULL SITE MAP — EVERY PAGE →
STORM ALERTS SOURCED FROM NOAA / NHC
SOUTH CAROLINA
496 Bramson Court, Suite 100
Mount Pleasant, SC 29464
CALL OR TEXT
FLORIDA
Tampa, FL
CALL OR TEXT
CLAIMS 9
DENIALS 8
BAD FAITH 7
COVERAGE 12
COMMERCIAL 8
ROOFS 8
TREES 5
DIRECTORIES
STORMS 51
WEATHER
NEWS & SITE 19
STORM ARCHIVE, CITIES & NEWS
Most recent below. Every storm dossier, city resource, and article is on its hub (linked at each heading) or the grouped site map →. All 46 carriers and 97 public-adjuster firms are in the Directories column above.
STORM ARCHIVE · 51 →
Hurricane Debby 2024Hurricane Helene 2024Hurricane Milton 2024Hurricane Idalia 2023Hurricane Ian 2022Hurricane Nicole 2022Hurricane Ida 2021Hurricane Laura 2020 View all 51 →
FLORIDA CITY RESOURCES · 29 →
Boca RatonBradentonCape CoralClearwaterDaytona BeachDestinFort LauderdaleFort Myers View all 29 →
SOUTH CAROLINA CITY RESOURCES · 8 →
BeaufortCharlestonColumbiaFlorenceGreenvilleHilton Head IslandMount PleasantMyrtle Beach
NEWS & UPDATES · 19 →

HurricaneLaw.Pro is an independent informational resource, not a law firm. Coverage summaries, policy-language quotations, dollar figures, deadlines, and chart examples throughout this site are general information based on typical or standard policy forms and are illustrative only — they are not a quote, a guarantee of coverage, or a promise of any outcome. Every insurance policy is different: your own policy, endorsements, and state law control, so read your policy and confirm current statutes. Weather imagery courtesy of NOAA, the National Hurricane Center, and the National Weather Service. Legal services are provided by our law firm partner, Halversen Law. Nothing on this site is legal advice; consult an attorney about your specific claim.

PrivacyTermsDisclaimerAboutContact
© 2026 HURRICANELAW.PRO — ALL RIGHTS RESERVED 27.9°N 82.5°W · ATLANTIC BASIN MONITOR
OUR LAW FIRM PARTNER
Halversen Law LICENSED · FLORIDA & SOUTH CAROLINA

All legal matters on this site are referred to and handled by our law firm partner, Halversen Law, a licensed law firm in Florida and South Carolina. HurricaneLaw.Pro is an informational resource and is not itself a law firm.
FREE CASE REVIEW