What a "spaghetti model" actually is
A spaghetti plot is simply many forecast models drawn on one map, each as its own colored line showing where that
model thinks a storm’s center will go. The nickname is literal: a dozen or more tracks tangled together look like
spaghetti thrown at a map. No single strand is "the forecast." The pattern of the strands is the
information: where they agree, where they split, and which way they’re trending.
Each line comes from a numerical weather model, a physics simulation of the atmosphere running on a
supercomputer. Feed it today’s observations, and it steps the atmosphere forward hour by hour. Different models
make different assumptions and run at different resolutions, so they disagree, and that disagreement, honestly
displayed, is exactly what a spaghetti plot captures.
The danger is reading them wrong. The single most common mistake a homeowner makes is finding the one line that
misses their town and exhaling. Forecasters never do that. They weigh all the models, lean on the best performers,
and fold in the trend across runs, which is exactly how the official NHC cone is built.
02THE MODELS BEHIND THE LINES Who’s who on the spaghetti map
Not all lines are equal. A handful of models do the heavy lifting, and knowing their track records tells you which
strands to trust when the plot gets tangled.
GFS USA · NOAA
Global Forecast System
The American global model, run 4× daily out to 16 days. Fast and freely available (the backbone of most U.S. forecasts), but historically a touch less accurate than the Euro at long-range hurricane tracks. The "American model" on the news.
ECMWF Europe · ECMWF
European model ("the Euro")
The European Centre model, widely regarded as the most accurate global model. It famously nailed Sandy’s 2012 left hook into New Jersey days ahead of the GFS. When the Euro and GFS agree, confidence is high; when they split, uncertainty is real.
HAFS USA · NOAA
Hurricane Analysis & Forecast System
NOAA’s newest hurricane-specific model, built to resolve a storm’s inner core, so it forecasts intensity and rapid strengthening better than the coarse global models. Purpose-built for exactly the storms that generate claims.
HWRF / HMON USA · NOAA
Hurricane-specific models
Older dedicated hurricane models still in the mix, run at high resolution around the storm. Good on structure and intensity, narrower in scope than the globals. Being retired in favor of HAFS.
UKMET UK
UK Met Office model
The British global model, another strong performer often shown on spaghetti plots. A useful third opinion when the GFS and Euro disagree.
ENSEMBLES USA / Europe
GEFS & EPS ensembles
Not one run but dozens: the same model launched with tiny changes to the starting conditions. If all the ensemble members bunch together, the forecast is trustworthy; if they scatter, even the models admit they don’t know yet.
Four rules for reading model spread
The whole skill is interpreting the pattern, not the individual lines. These four rules are how forecasters turn a
tangle of tracks into a decision.
01 CLUSTERING
Tight lines = confidence
When the spaghetti strands bunch into a narrow bundle, the models agree and the forecast is reliable. A tight cluster 3 days out is about as sure as tropical forecasting gets: treat it as the real threat and act on it.
02 SPREAD
A wide fan = real doubt
When the lines splay across hundreds of miles, the outcome genuinely isn’t settled yet. Do not relax because one strand misses you; a wide fan means your location is still in play and the forecast will tighten over the next day or two.
03 OUTLIERS
Ignore the lone stray line
There is almost always one model far from the pack. Forecasters discount these outliers, and so should you; never anchor hope (or panic) on the single line that misses (or hits) your town. The consensus is what matters.
04 TREND
Watch the run-to-run shift
A single map is a snapshot; the trend is the signal. If each new model cycle nudges the cluster toward your coast, the threat is growing regardless of where today’s lines sit. Consistency across runs beats any one run.
04THE CONE VS THE SPAGHETTI Why the cone is the one that counts
Spaghetti shows you the raw disagreement. The NHC cone is the expert synthesis of it: the models plus human
forecasters plus a century of error statistics. When they seem to conflict, the cone wins.
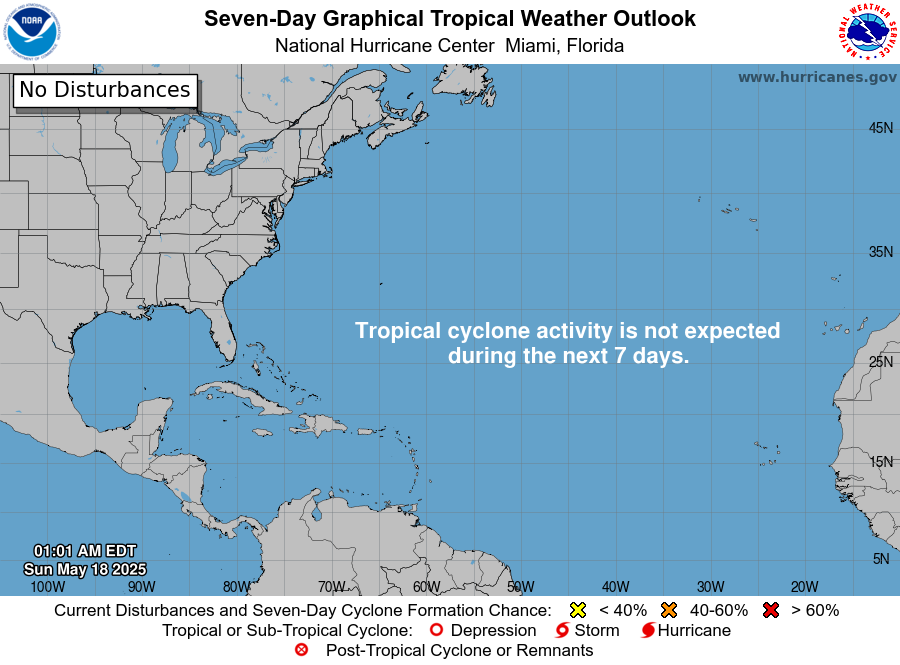
7-DAY TROPICAL OUTLOOK NOAA / NHC WHAT IT SHOWSWith no active storm, this is the NHC 7-day outlook: the map that shows where a future system, and its eventual cone, will first appear.
HOW TO READ ITThe cone is the probable path of the center, widened over time to cover two-thirds of historical forecast error. It is deliberately conservative, built so the center stays inside it about 2 times out of 3.
WHY IT MATTERSWhen a storm forms, its cone appears here and on the tracker automatically. This is always the graphic to plan around: the spaghetti is context, the cone is the call.
Open full-size at the source ↗
CONE ≠ SIZE · CONE ≠ SAFE OUTSIDE
Two things the cone is not
The cone is not the size of the storm. It maps only where the center may track. A large
hurricane’s damaging wind, surge, and rain spread far beyond the cone’s edges, sometimes a hundred miles or
more.
Outside the cone is not "safe." Roughly a third of the time the center itself lands outside
the cone, and hazards reach wider still. Being just off the line is a reason to prepare, not to relax.
For a claim, the practical rule is simple: if the cone is anywhere near your county, treat landfall as
possible and get your evidence file built before the storm, not after.
See every active cone on the tracker → 05WHERE TO WATCH THE LIVE PLOTS The plots we trust, straight from the source
We don’t rehost anyone’s model plots; the forecasters who build them deserve the traffic and the credit. Here is
where to watch the real thing, and what each one is best for.
OFFICIAL nhc.noaa.gov ↗
National Hurricane Center
The official source. Forecast cone, advisories, watches and warnings; the one to plan around. Free, public domain.
MODELS tropicaltidbits.com ↗
Tropical Tidbits
The forecaster’s favorite: clean model and ensemble plots, storm-by-storm, updated each run. The clearest free spaghetti maps anywhere.
AGGREGATOR spaghettimodels.com ↗
Spaghetti Models
The classic aggregator (a.k.a. Mike’s Weather Page): every model plot and satellite in one busy dashboard. The inspiration we built the airy version of.
INTERACTIVE windy.com ↗
Windy
An interactive map to fly the GFS, ECMWF, and more yourself: wind, rain, and pressure animated across the globe. Best for seeing the whole flow, not just the track.
NHC IMAGERY: NOAA / NATIONAL HURRICANE CENTER (PUBLIC DOMAIN) · MODEL PLOTS ARE THE WORK OF THEIR RESPECTIVE
SITES · LINKED, NOT REHOSTED
Forecast-model explanations are educational and simplified; model performance varies storm to storm. NHC cone and
outlook imagery is public domain, hotlinked and credited from the source. Model and ensemble plots belong to
Tropical Tidbits, Spaghetti Models, Windy, and the modeling centers; we link to them rather than rehost.
HurricaneLaw.Pro is not a forecaster; always follow official NHC advisories for
life-safety decisions.