PROPERTY-INSURANCE CLAIM HELP · FL & SC FL CITIESSC CITIESGUIDESTATESNEWSSITE MAPABOUT
HurricaneLaw.Pro HURRICANELAW.PRO
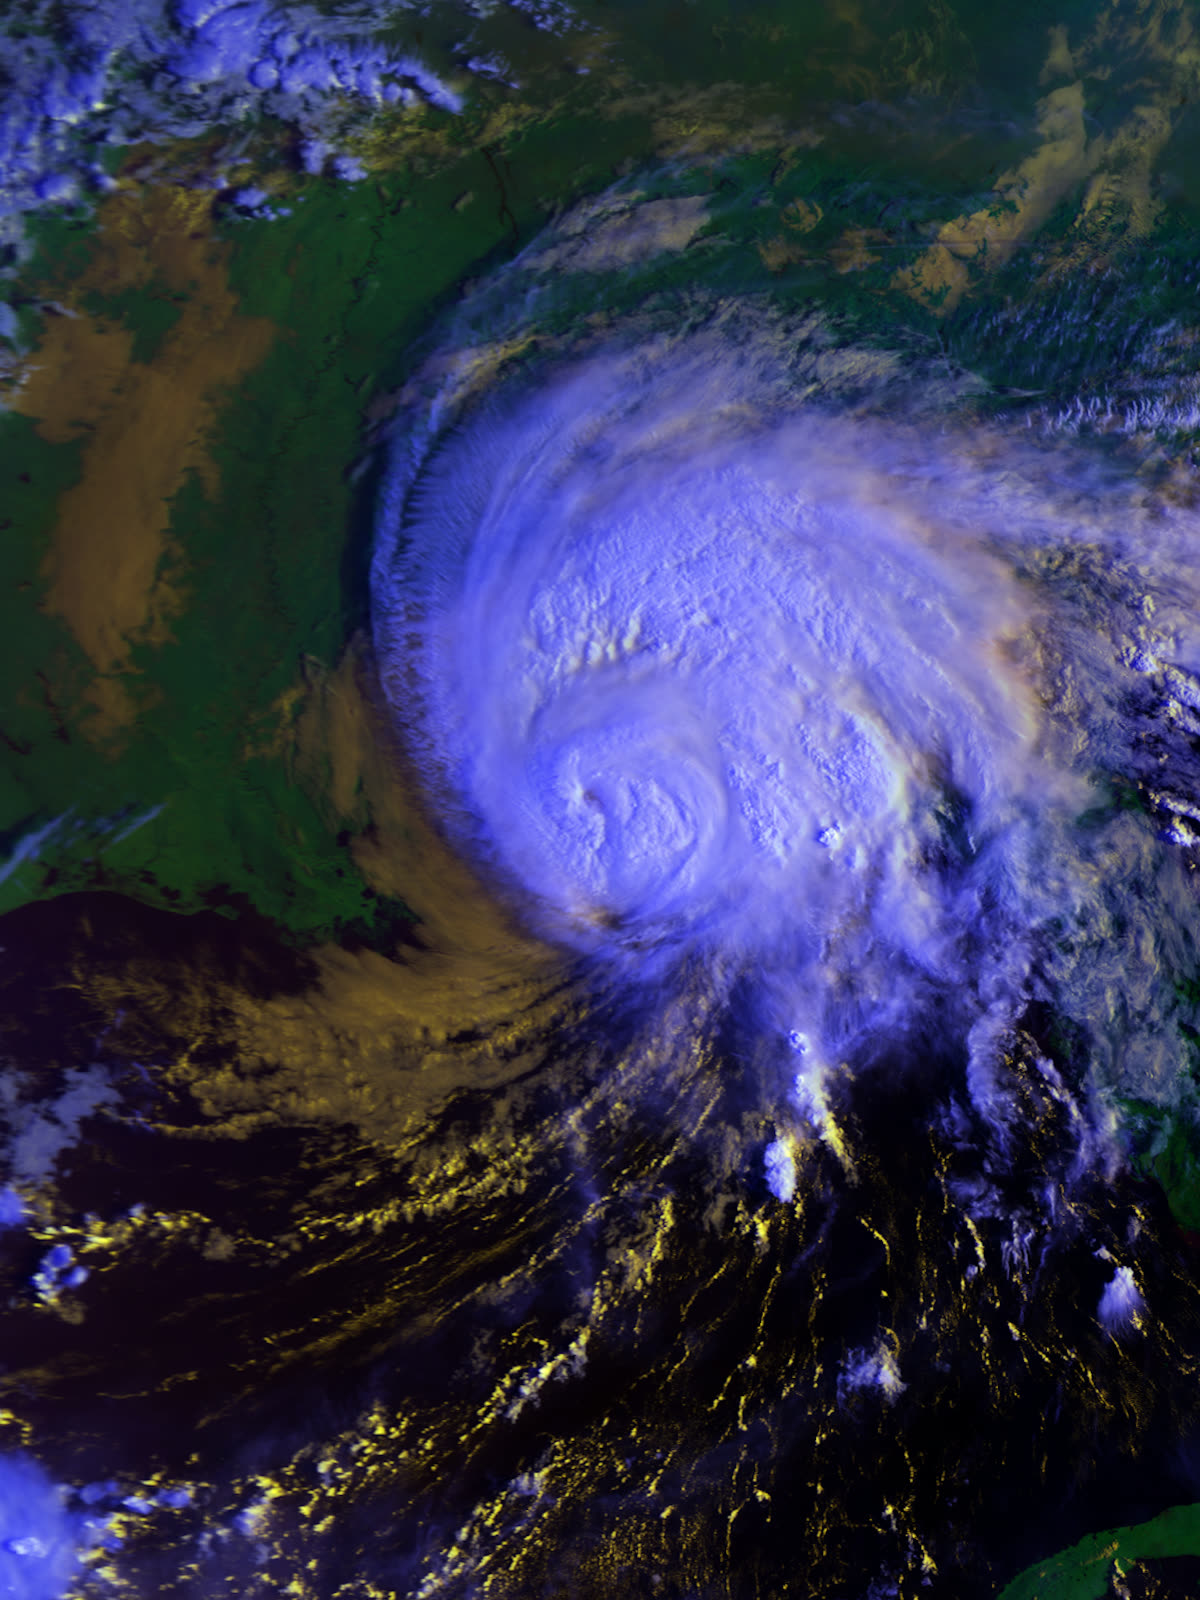
Sally over the Gulf Coast on September 16, 2020, hours after its Category 2 landfall at Gulf Shores
STORM ARCHIVE / 2020 LANDFALL 30.3°N 87.7°W
CAT 2 FL · 2020 · 110 mph

Hurricane Sally

Landfall: Gulf Shores, AL (flood core over Pensacola, FL) · 2020-09-16. Sally dropped 2 feet of rain on Pensacola — and turned Northwest Florida into a case study in wind-versus-flood claim disputes

NOAA (MetOp-A)
AT LANDFALL
CAT 2
PEAK WIND
110 mph
PRESSURE
965 mb
STORM SURGE
5-7 ft
DAMAGE
$7.3B
DEATHS
8
01 THE PATH

Where it hit, start to finish

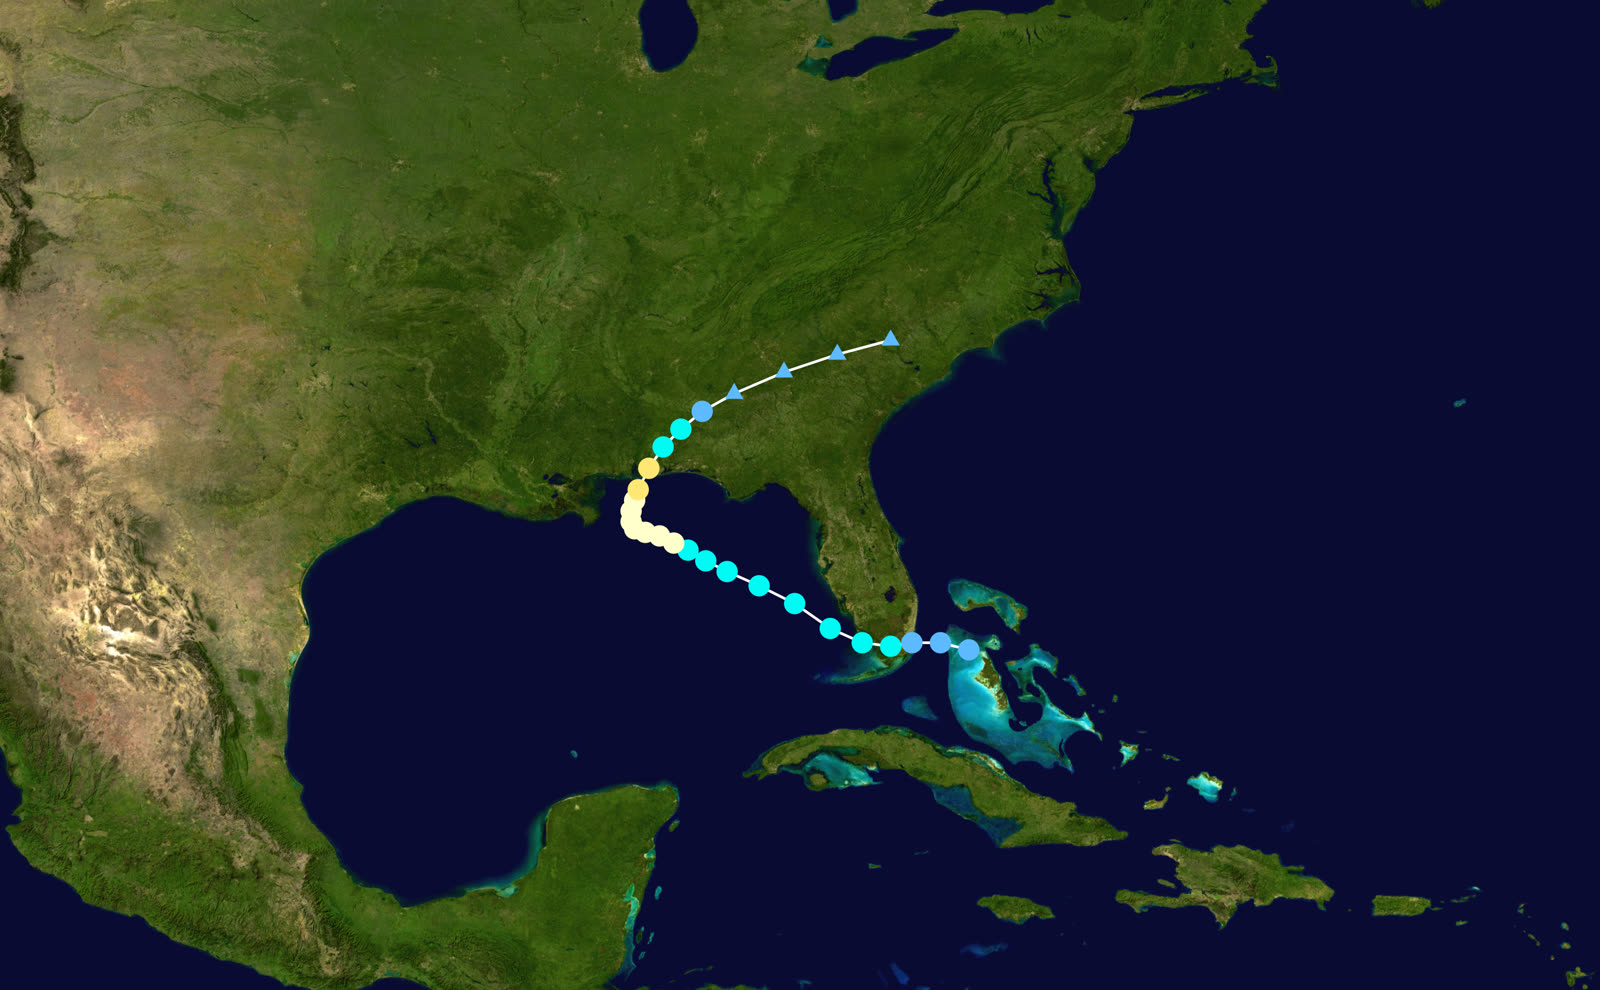
TRACK · HURRICANE SALLYNOAA / NHC (best-track data)
Best track of Hurricane Sally, September 11-17, 2020 — note the crawl at the coast
North-central Gulf
SLOW, ERRATIC, LATE-STRENGTHENING

Sally crawled toward the coast at 2-5 mph for days, then intensified sharply in its final hours over the Gulf — a forecast nightmare that stretched preparation time and rainfall totals alike.

Gulf Shores, AL
CAT 2 LANDFALL - 110 MPH

Landfall 4:45 a.m. CDT September 16 at Gulf Shores, 965 mb — on the 16th anniversary of Hurricane Ivan striking the same coastline.

Pensacola / Escambia County, FL
TWO FEET OF RAIN, 5+ FT SURGE

Sally's slow motion parked its wettest bands over Pensacola: roughly 24 inches of rain plus a 5-7 ft surge flooded downtown, sank or beached hundreds of boats, and inundated thousands of homes.

Pensacola Bay Bridge
BARGES DESTROY THE THREE MILE BRIDGE

Construction barges owned by contractor Skanska broke loose in the storm; one knocked out spans of the new Pensacola Bay Bridge, severing the corridor for months and spawning years of litigation.

Santa Rosa / inland FL-AL-GA
RIVER FLOODING INLAND

Rivers across the western Panhandle and south Alabama hit major flood stage as Sally's rain drained; the storm weakened over Georgia and exited September 17. Toll: 8 deaths, $7.3 billion.

02 THE RECORD IN IMAGES
ALL IMAGERY U.S. GOV / PUBLIC DOMAIN
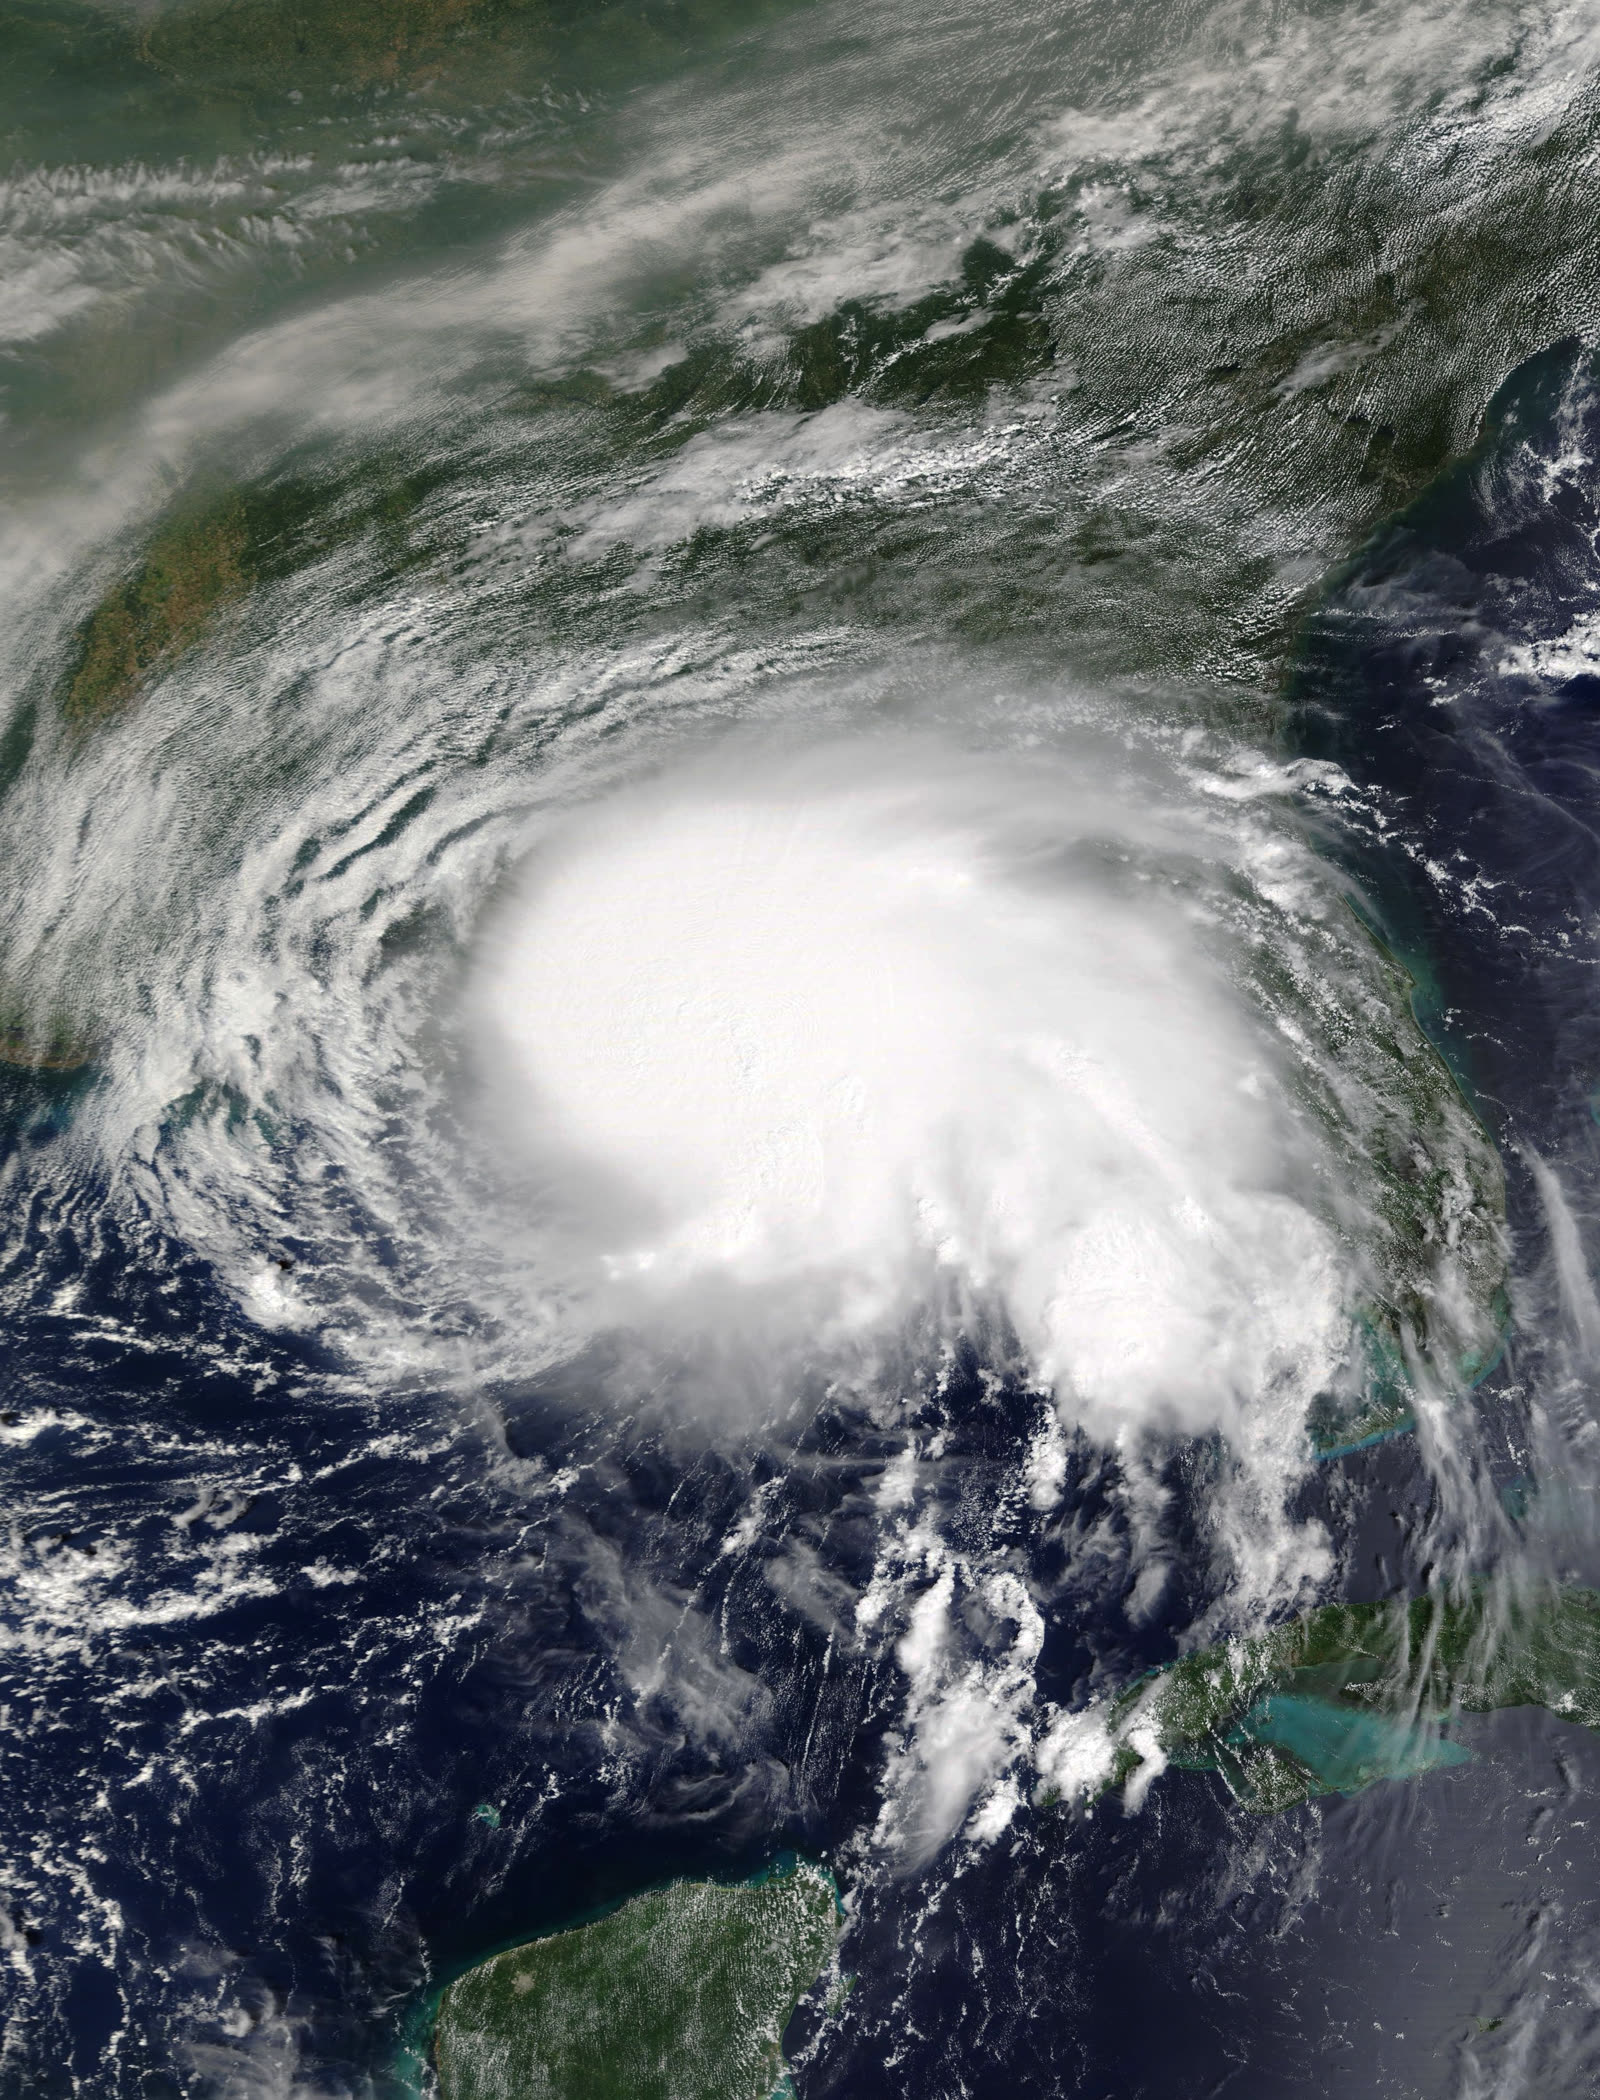
SATELLITE NASA
Sally strengthening in the north-central Gulf on September 14, two days before landfall
RADAR NOAA / NWS
Radar loop of Sally's landfall — training rain bands sat over Pensacola for more than a day
CONE NOAA / NHC
NHC forecast cone for Sally as it approached the northern Gulf Coast
MAP NOAA / NWS
Storm-total rainfall — nearly 30 inches fell near the AL/FL line, two feet on Pensacola
FLOOD US Coast Guard
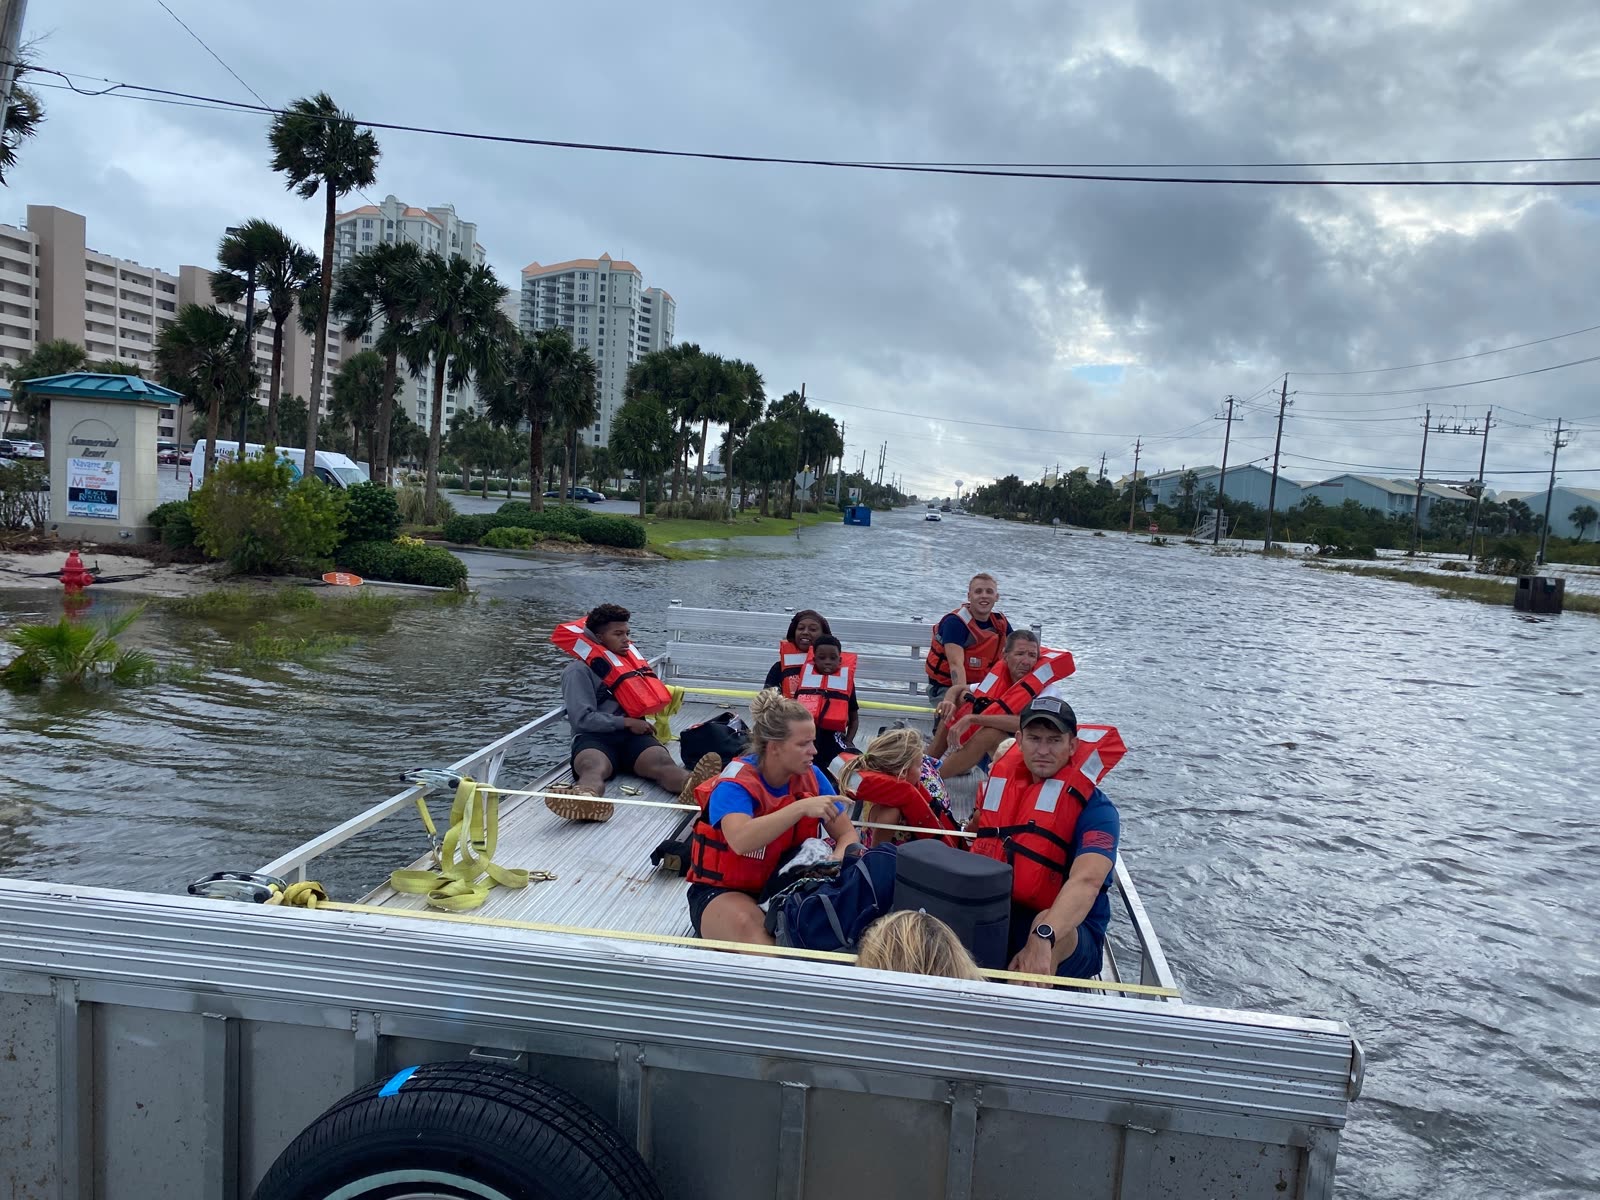
Coast Guard shallow-water team rescuing residents from floodwater near Navarre Beach, FL, September 16
DAMAGE NOAA
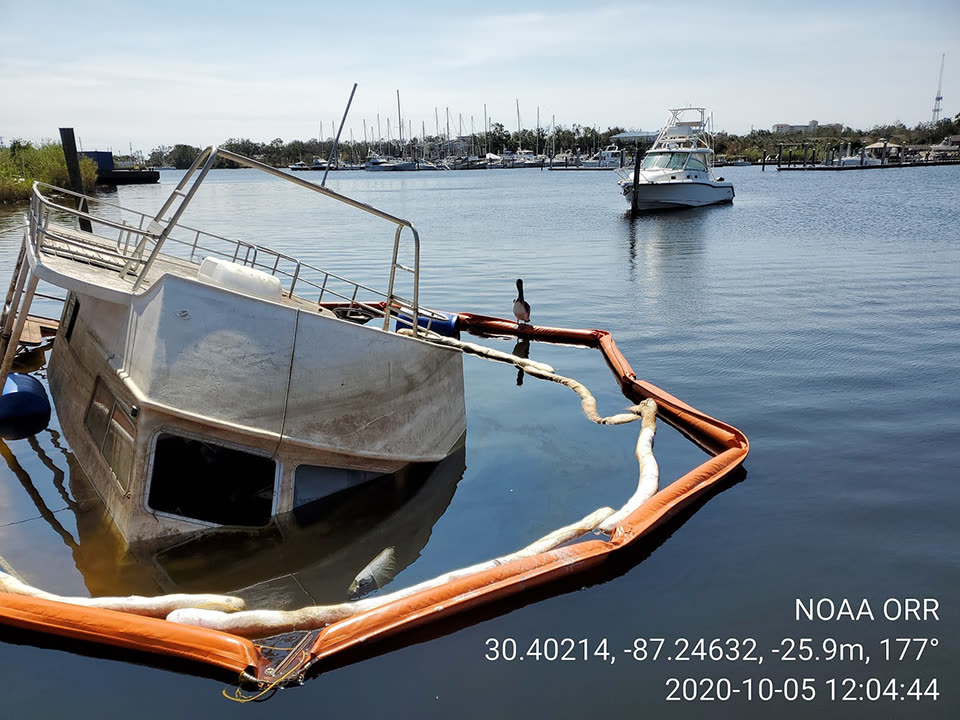
Vessel thrown ashore by Sally's surge — hundreds of boats were sunk or beached around Pensacola Bay

The storm

Sally was slow — and slowness was the whole disaster. The storm crossed South Florida as a weak system on September 12, 2020, then crept across the northern Gulf at 2-5 mph, drifting west, stalling, and finally turning north. In its last hours over water, it intensified sharply and made landfall at Gulf Shores, Alabama, at 4:45 a.m. CDT on September 16 as a Category 2 with 110 mph winds — sixteen years to the day after Ivan hit the same coast.

The eye came ashore in Alabama, but the flood core sat over Northwest Florida. Sally's strongest rainbands trained over Pensacola for more than a day: roughly 24 inches of rain in Pensacola, nearly 30 near the state line, on top of a 5-7 foot storm surge into Pensacola Bay and the sounds behind Perdido Key and Navarre Beach. Eight deaths and $7.3 billion in damage were attributed to the storm.
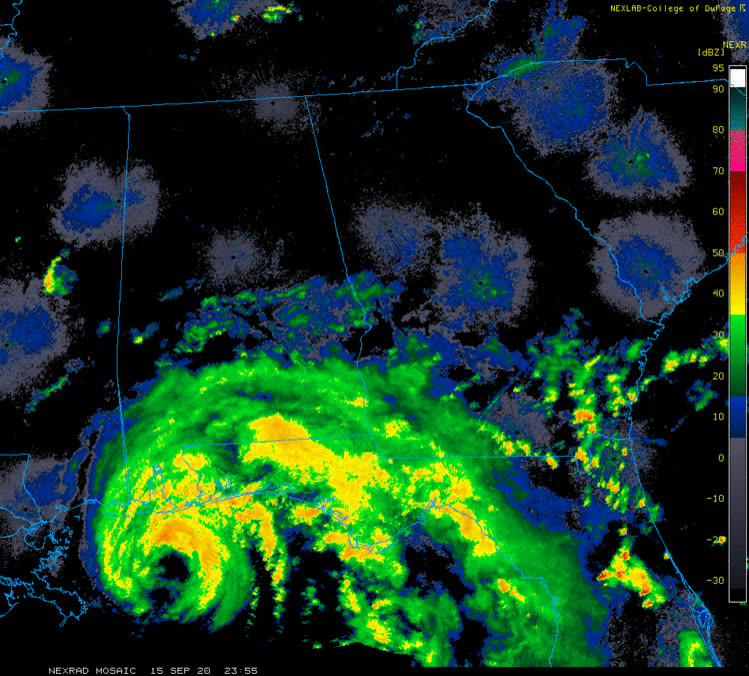
Radar loop of Sally's landfall — training rain bands sat over Pensacola for more than a day
Radar loop of Sally's landfall — training rain bands sat over Pensacola for more than a day NOAA / NWS

The damage

Escambia and Santa Rosa counties took the brunt. Downtown Pensacola streets flooded; thousands of homes took water from surge, rain, or both; hundreds of boats sank or were thrown ashore around the bays. Wind stripped roofs across the metro — then the training rain fell into every opening the wind had made.

The signature loss was infrastructure: construction barges owned by bridge contractor Skanska broke loose during the storm, and one took out spans of the brand-new Pensacola Bay ("Three Mile") Bridge. The corridor between Pensacola and Gulf Breeze was severed for months, strangling commerce on both sides. Inland, rivers across the western Panhandle and south Alabama crested at major flood stage for days.
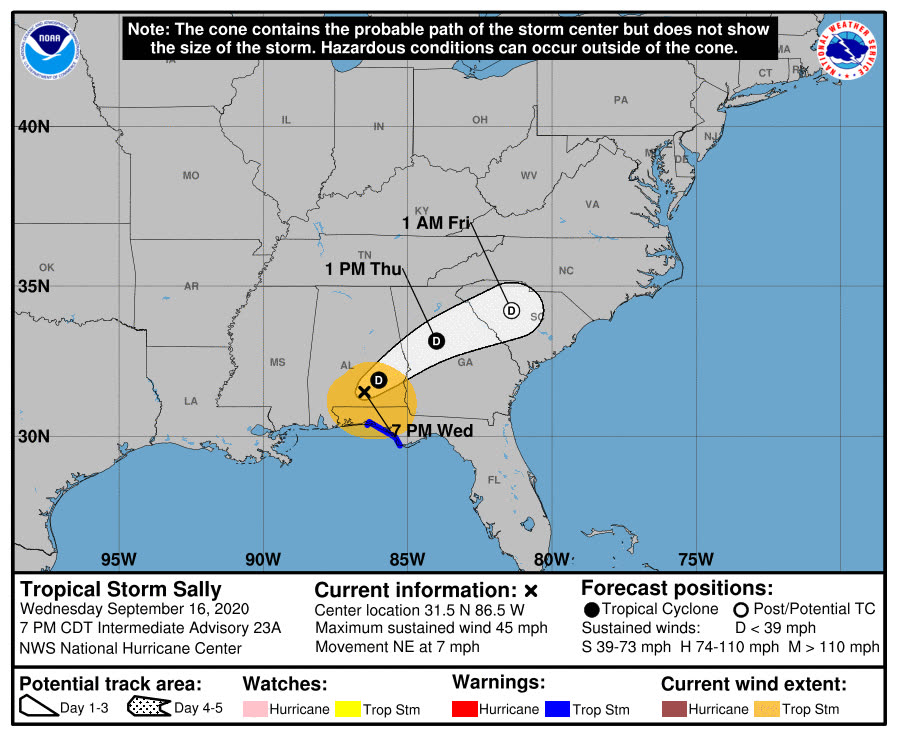
NHC forecast cone for Sally as it approached the northern Gulf Coast
NHC forecast cone for Sally as it approached the northern Gulf Coast NOAA / NHC

The insurance aftermath

Nine days after landfall, FLOIR's data call already showed 56,852 Florida claims and $300.7 million in estimated insured losses; industry-wide US estimates ran $1-3 billion. But Sally's real legacy is the coverage line it forced tens of thousands of Panhandle households to litigate in miniature: wind or water?

Sally delivered every water peril at once. Rain that entered through wind-opened roofs is generally covered under homeowners policies; rising surge and rainwater flooding from the ground up is excluded flood. Carriers and policyholders fought over which path the water took, house by house. Adjusters attributing interior water damage to excluded "flood" — or to policy limitations on wind-driven rain — became the dominant Panhandle complaint, and the dispute pattern repeated Michael's from two years earlier. Households without NFIP or private flood coverage — most inland households, and many coastal ones — had no policy response at all for ground-up flooding.

The Skanska barge strikes produced their own claims universe. A federal court in 2021 rejected Skanska's attempt to limit its liability, finding the company negligent for leaving barges in the water with a hurricane forecast — opening the door for economic-loss claims from businesses cut off by the bridge outage, alongside property suits. The episode became a rare instance where a third-party negligence claim, not a first-party insurance policy, was the better recovery route for storm losses.

Sally also hit an already-stressed Florida market: Panhandle carriers were still bleeding from Michael litigation, and Sally's claims added to the loss creep that fed the 2021-2022 insolvency wave and reform sessions.
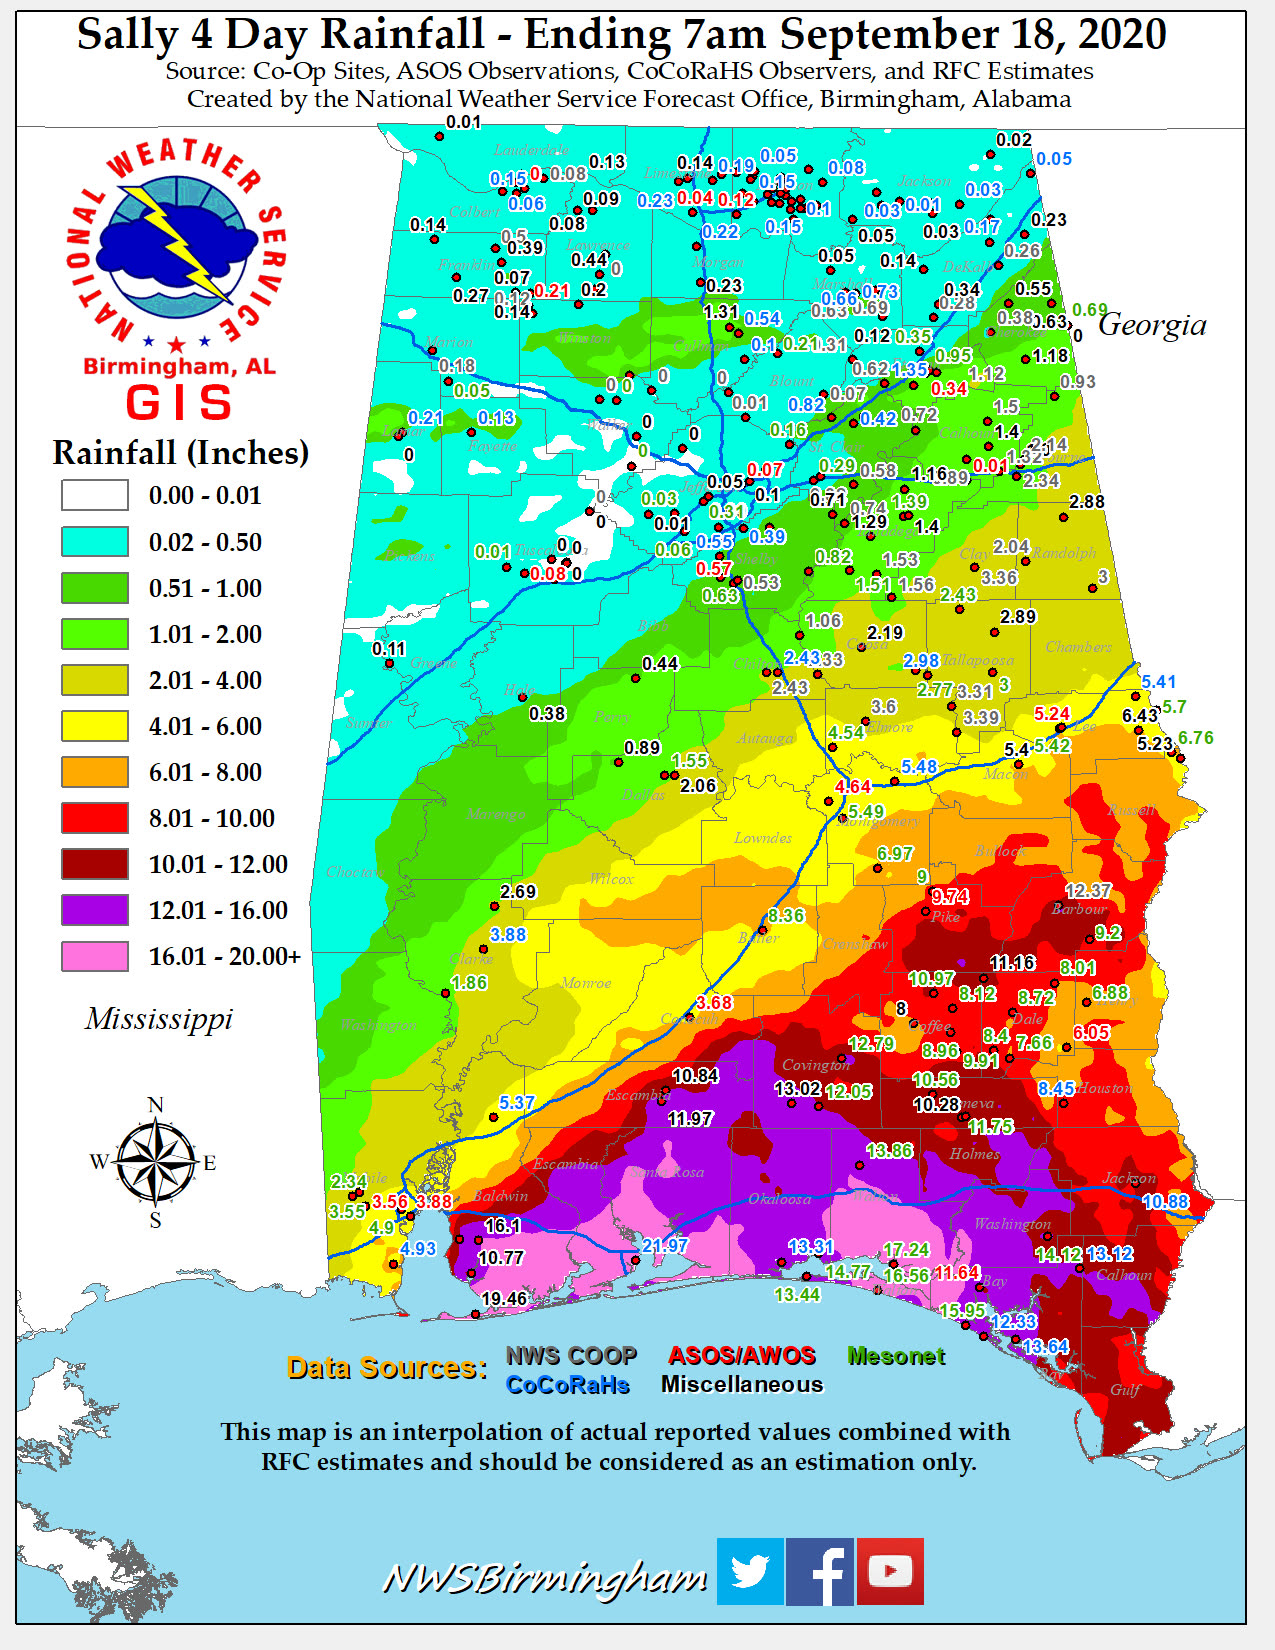
Storm-total rainfall — nearly 30 inches fell near the AL/FL line, two feet on Pensacola
Storm-total rainfall — nearly 30 inches fell near the AL/FL line, two feet on Pensacola NOAA / NWS

What policyholders learned

  • The wind-vs-water fight is won with evidence of sequence. Photos and video during the storm — roof damage before water rose — preserved the covered wind portion of mixed claims.
  • "Wind-driven rain" limitations were the quiet denial. Policies requiring a storm-created opening before interior water is covered led to denials where roofs "held"; interior water without flood insurance then fell in the gap.
  • Two feet of rain floods homes far from any flood zone. Ground-up rainwater flooding is excluded from homeowners policies everywhere, not just on the coast; NFIP take-up inland was thin.
  • A third party's negligence can outperform your policy. Businesses and owners harmed by the Skanska barges recovered through litigation, not insurance — worth checking when infrastructure fails during a storm.
  • Slow storms multiply supplements. Damage kept emerging as rain continued for days after landfall; owners who re-documented and filed supplemental claims captured losses missed in the first inspection.

Independent informational resource — not legal advice. Damage figures are nominal (not inflation-adjusted) unless noted. Insurance-law summaries are drafted for education; consult an attorney about your specific claim.

AT LANDFALL · HURRICANE SALLY · 2020
5-7 ft
OF STORM SURGE · PENSACOLA BAY AREA
HURRICANELAW.PRO FIELD FOOTAGE
03 THE FULL RECORD

Every official record of Sally

Reports, imagery archives, flood data, and claims records — straight from the agencies.

OUR LAW FIRM PARTNER · HALVERSEN LAW
Sally claim denied?
CALL FL941-390-3233CALL SC843-542-0454FREE CLAIM REVIEW
RELATED GUIDES
HurricaneLaw.Pro HURRICANELAW.PRO

The independent policyholder resource for Florida & South Carolina — storm archive, coverage law, denials, bad faith, and the complete claims playbook. 51 storms · 46 carriers · 97 public-adjuster firms · 37 city guides.

▸ SEE THE FULL SITE MAP — EVERY PAGE →
STORM ALERTS SOURCED FROM NOAA / NHC
SOUTH CAROLINA
496 Bramson Court, Suite 100
Mount Pleasant, SC 29464
CALL OR TEXT
FLORIDA
Tampa, FL
CALL OR TEXT
CLAIMS 9
DENIALS 8
BAD FAITH 7
COVERAGE 12
COMMERCIAL 8
ROOFS 8
TREES 5
DIRECTORIES
STORMS 51
WEATHER
NEWS & SITE 19
STORM ARCHIVE, CITIES & NEWS
Most recent below. Every storm dossier, city resource, and article is on its hub (linked at each heading) or the grouped site map →. All 46 carriers and 97 public-adjuster firms are in the Directories column above.
STORM ARCHIVE · 51 →
Hurricane Debby 2024Hurricane Helene 2024Hurricane Milton 2024Hurricane Idalia 2023Hurricane Ian 2022Hurricane Nicole 2022Hurricane Ida 2021Hurricane Laura 2020 View all 51 →
FLORIDA CITY RESOURCES · 29 →
Boca RatonBradentonCape CoralClearwaterDaytona BeachDestinFort LauderdaleFort Myers View all 29 →
SOUTH CAROLINA CITY RESOURCES · 8 →
BeaufortCharlestonColumbiaFlorenceGreenvilleHilton Head IslandMount PleasantMyrtle Beach
NEWS & UPDATES · 19 →

HurricaneLaw.Pro is an independent informational resource, not a law firm. Coverage summaries, policy-language quotations, dollar figures, deadlines, and chart examples throughout this site are general information based on typical or standard policy forms and are illustrative only — they are not a quote, a guarantee of coverage, or a promise of any outcome. Every insurance policy is different: your own policy, endorsements, and state law control, so read your policy and confirm current statutes. Weather imagery courtesy of NOAA, the National Hurricane Center, and the National Weather Service. Legal services are provided by our law firm partner, Halversen Law. Nothing on this site is legal advice; consult an attorney about your specific claim.

PrivacyTermsDisclaimerAboutContact
© 2026 HURRICANELAW.PRO — ALL RIGHTS RESERVED 27.9°N 82.5°W · ATLANTIC BASIN MONITOR
OUR LAW FIRM PARTNER
Halversen Law LICENSED · FLORIDA & SOUTH CAROLINA

All legal matters on this site are referred to and handled by our law firm partner, Halversen Law, a licensed law firm in Florida and South Carolina. HurricaneLaw.Pro is an informational resource and is not itself a law firm.

FREE CASE REVIEW