FLOOD-ZONE MAP FEMA NFHL · LIVE Where the high-risk flood zones are in Miami
This is Miami drawn live from FEMA’s National Flood Hazard Layer. Every shaded area is a
Special Flood Hazard Area, a high-risk zone where a federally backed mortgage requires flood
insurance, and the first thing a carrier checks after a water loss. Your homeowners policy does not cover
flood; that takes a separate NFIP or private flood policy. Pan and zoom to your street to see your zone.
FEMA FLOOD ZONES · MIAMI Loading live data…
Zone VE
Coastal high-hazard. Storm surge with waves on top, the most dangerous zone, along the open water.
Zone AE
The 1%-annual-chance floodplain (the “100-year” zone). FEMA sets a Base Flood Elevation here.
A / AH / AO
Other high-risk areas, shallow sheet flooding, ponding, or floodplain not yet studied in detail.
Unshaded (X)
Moderate-to-low risk, not no risk. Over a quarter of federal flood claims come from outside the high-risk zones.
Drawn live from FEMA’s National Flood Hazard Layer. Absence of shading is not a guarantee against flooding; confirm your exact address at the
FEMA Map Service Center.
LIVE CONDITIONS NWS · NOAA · LIVE Radar, forecast & tides for Miami
Live from the National Weather Service and NOAA, the local Doppler loop, the official 7-day forecast, and the
next high and low tides. Tides and surge timing decide how bad a coastal flood gets; a storm arriving at high
tide floods far more than the same storm at low tide.
DOPPLER RADAR · KAMXNWS NEXRAD · IEM

NEXT TIDESNOAA · Virginia Key, Biscayne Bay
Loading NOAA tide predictions…
MARINE FORECAST · BISCAYNE BAYNWS
Loading NOAA coastal-waters forecast…
Source: NOAA National Weather Service & CO-OPS Tides & Currents, public domain. Tide heights are predictions
(datum MLLW), not observed water levels. During a storm, follow official NWS warnings, not this page.
How the risk changes across Miami
Flood exposure is hyper-local. These are the broad patterns by area, keyed to FEMA zones and the way water
moves here, surge off the bay, the Miami-Dade County river system, and low interior drainage. General
reference only; confirm your exact address on the map above.
Miami Beach VE / AE
STORM SURGE
Barrier island across Biscayne Bay, among the most surge- and tide-exposed ground in the county, with VE at the open shoreline and AE across most blocks.
Brickell AE
COASTAL FLOOD
Bayfront high-rise corridor; AE flooding from surge, storm drainage backup, and king-tide inundation on low streets.
Downtown / Edgewater AE
COASTAL FLOOD
Low and bayfront along Biscayne Bay; AE flooding drives claims, with wind exposure on the towers.
Coconut Grove AE / X
COASTAL FLOOD
Bayfront blocks sit in AE; the higher hammock ground inland moves to X, so risk varies street to street.
Key Biscayne VE / AE
STORM SURGE
Barrier island off the bay, surge-exposed on all sides, VE at the ocean edge and AE across the island.
Coral Gables (waterfront) AE / X
SURGE + FLOOD
Gables-by-the-Sea and canal-front blocks flood in AE; interior Gables sits higher in X.
Little Havana X
INLAND / LOWER
On the higher coastal ridge and mostly X, but low blocks and clogged drainage flood in extreme rain.
Wynwood / Midtown X
INLAND / LOWER
Inland and largely X; the peril here is wind and heavy-rain street flooding rather than surge.
Cutler Bay / South Dade AE
STORM SURGE
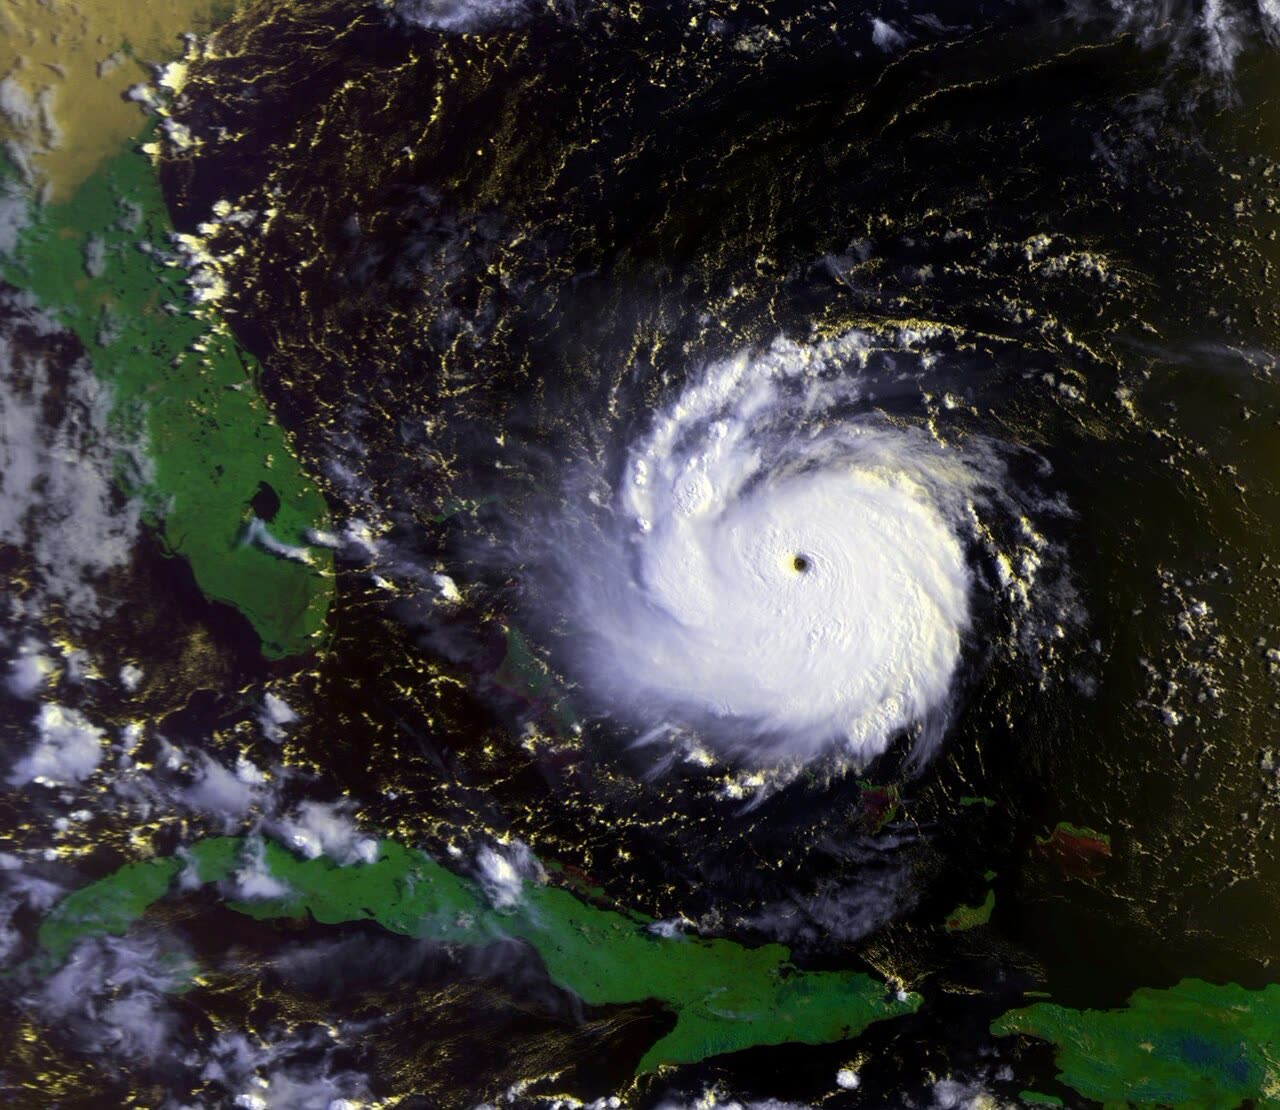
Low southern bayfront, the ground Andrew's core crossed in 1992; AE surge and rain flooding drive claims.
LOCAL RESOURCES GOV · NOAA · FEMA Miami disaster, insurance & mitigation resources
The official sources, emergency management, weather, insurance regulators, and property maps. Links open in a
new tab; agencies change their sites, so if one has moved, search the agency name.
Shelter, food & immediate help
Debris, cleanup & rebuilding
Maps, property & mitigation
Links to government & NOAA sources, public domain. Listing a resource is not endorsement. Flood zones and
elevations are general reference; confirm your exact address with the official source before acting.