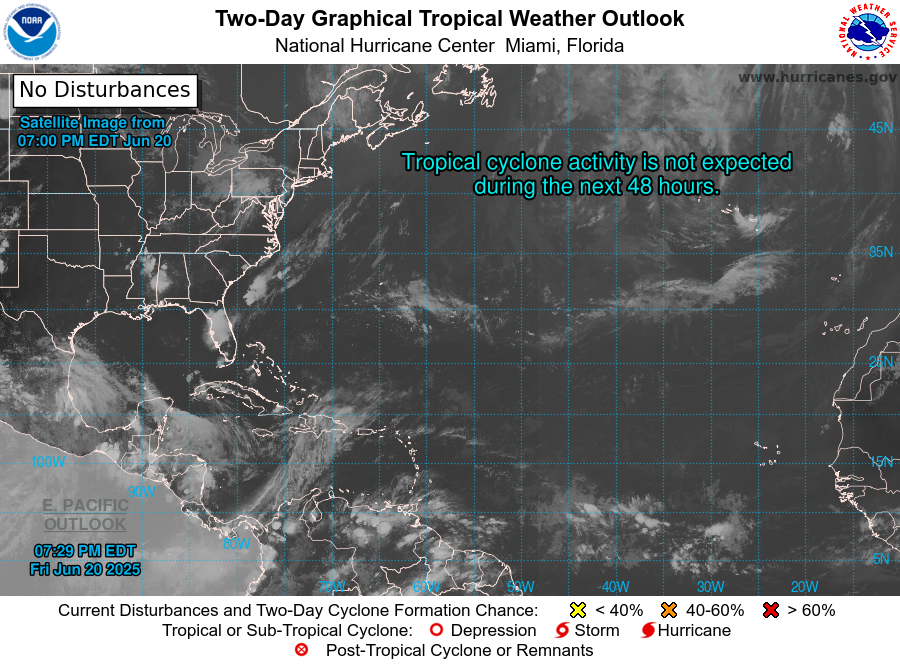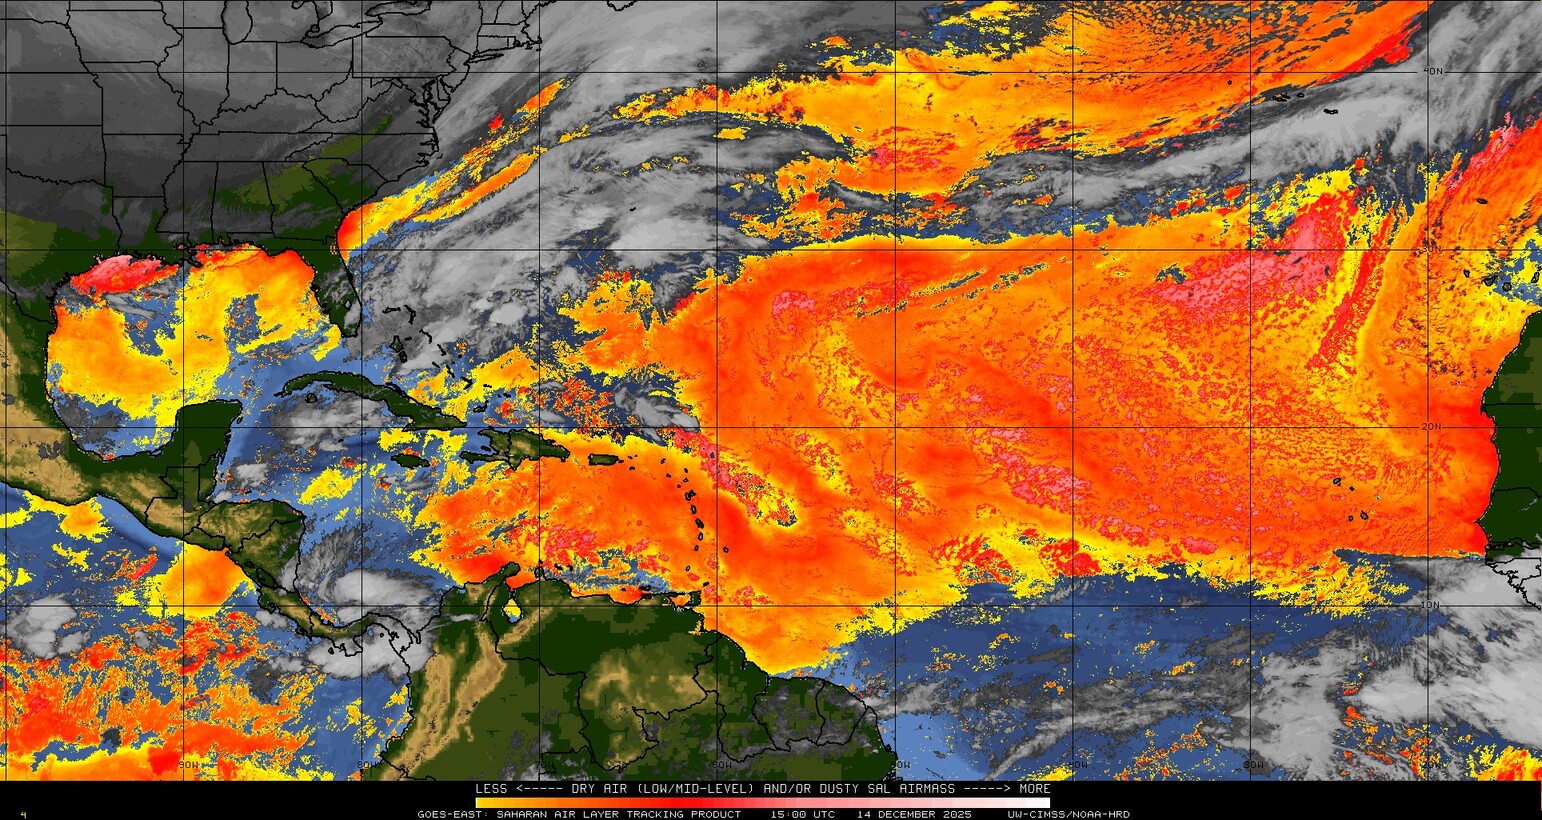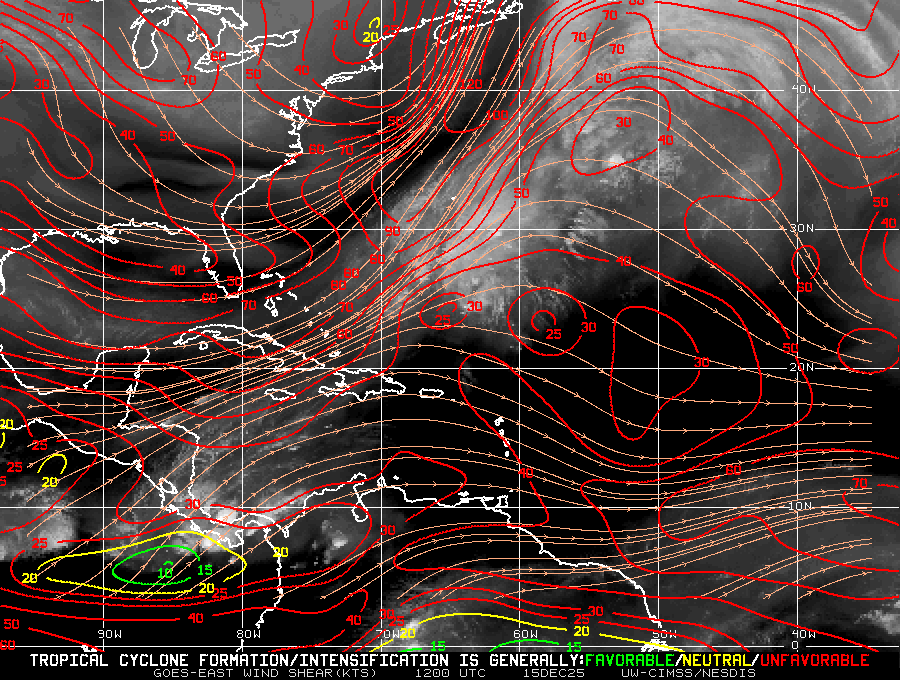
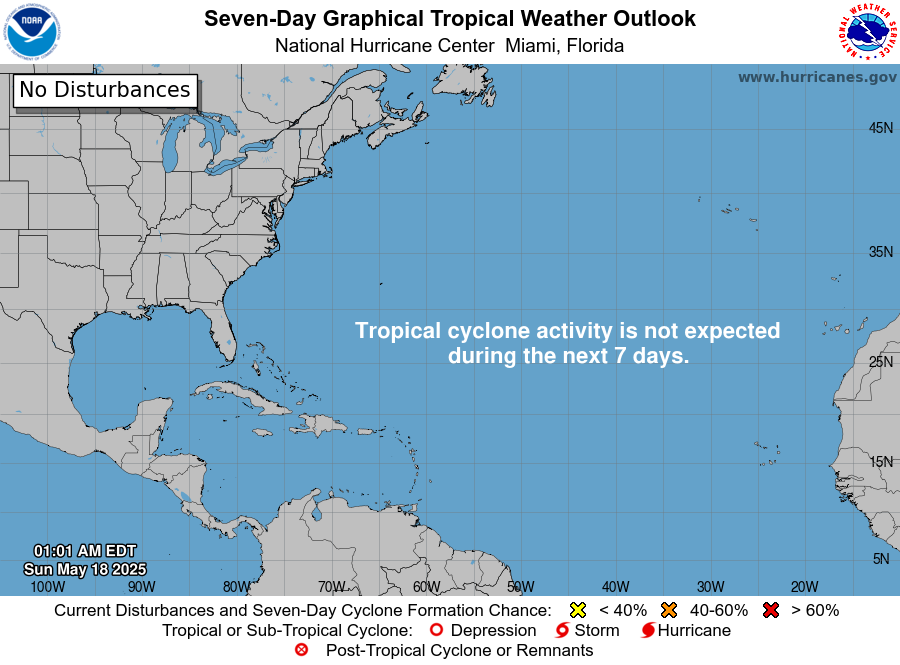
WHAT IT SHOWSThe National Hurricane Center's map of every area it is watching for tropical development over the next 7 days, each marked with a colored X and a development percentage.
HOW TO READ ITYellow X = low odds (≤40%). Orange = medium (50 to 60%). Red = high (≥70%). The hatched area is where a system could form, not a forecast track. Off-season, this map correctly reads 'no tropical cyclones expected.'
WHY IT MATTERSThis is the earliest actionable warning a homeowner gets. A high-odds red X aimed at the Gulf or the Southeast coast is your cue to start your storm file and photograph your roof days before any watch is issued.
Open full-size at the source ↗